EP1136836A2 - T2 contrast in magnetic resonance imaging with gradient echoes - Google Patents
T2 contrast in magnetic resonance imaging with gradient echoes Download PDFInfo
- Publication number
- EP1136836A2 EP1136836A2 EP01302617A EP01302617A EP1136836A2 EP 1136836 A2 EP1136836 A2 EP 1136836A2 EP 01302617 A EP01302617 A EP 01302617A EP 01302617 A EP01302617 A EP 01302617A EP 1136836 A2 EP1136836 A2 EP 1136836A2
- Authority
- EP
- European Patent Office
- Prior art keywords
- images
- gradient
- data
- gradient echo
- nonlinear function
- Prior art date
- Legal status (The legal status is an assumption and is not a legal conclusion. Google has not performed a legal analysis and makes no representation as to the accuracy of the status listed.)
- Granted
Links
Images


Classifications
-
- G—PHYSICS
- G01—MEASURING; TESTING
- G01R—MEASURING ELECTRIC VARIABLES; MEASURING MAGNETIC VARIABLES
- G01R33/00—Arrangements or instruments for measuring magnetic variables
- G01R33/20—Arrangements or instruments for measuring magnetic variables involving magnetic resonance
- G01R33/44—Arrangements or instruments for measuring magnetic variables involving magnetic resonance using nuclear magnetic resonance [NMR]
- G01R33/48—NMR imaging systems
- G01R33/50—NMR imaging systems based on the determination of relaxation times, e.g. T1 measurement by IR sequences; T2 measurement by multiple-echo sequences
Definitions
- the present invention relates generally to the field of Magnetic Resonance Imaging (MRI) and Magnetic Resonance Spectroscopy (MRS), and more particularly, to a method and apparatus for gradient echo MR imaging to measure a T2 relaxation rate constant and/or to create T2 contrast images together with T1 or spin density and T2* weighted images, all from the same MR data set.
- MRI Magnetic Resonance Imaging
- MRS Magnetic Resonance Spectroscopy
- polarizing field B 0 When a substance such as human tissue is subjected to a uniform magnetic field (polarizing field B 0 ), the individual magnetic moments of the spins in the tissue attempt to align with this polarizing field, but precess about it in random order at their characteristic Larmor frequency. If the substance, or tissue, is subjected to a magnetic field (excitation field B 1 ) which is in the x-y plane and which is near the Larmor frequency, the net aligned moment, or "longitudinal magnetization", M Z , may be rotated, or "tipped", into the x-y plane to produce a net transverse magnetic moment M t . A signal is emitted by the excited spins after the excitation signal B 1 is terminated and this signal may be received and processed to form an image.
- excitation field B 1 which is in the x-y plane and which is near the Larmor frequency
- magnetic field gradients G x G y and G z
- the region to be imaged is scanned by a sequence of measurement cycles in which these gradients vary according to the particular localization method being used.
- the resulting set of received NMR signals are digitized and processed to reconstruct the image using one of many well-known reconstruction techniques.
- T2 weighted imaging is generally associated with long imaging times, as compared to T1 weighted imaging. T1 imaging is much faster since such imaging is achieved by shortening the repetition time.
- T2 relaxation time in MRI or MRS, as well as creating T2 contrast in MRI typically requires use of a version of spin echo (SE) pulse sequences. These sequences can differ in how signal excitation, phase encoding, and acquisition are combined together to form a pulse sequence. Different pulse sequences result in different image acquisition times, signal-to-noise (SNR) ratios and image contrasts.
- SE spin echo
- SNR signal-to-noise
- the most frequently used sequences for clinical diagnostic applications are traditional multi-slice two-dimensional Fourier Transform SE sequences and single-slice fast spin echo sequence techniques such as the Rapid Acquisition Relaxation Enhanced (RARE) sequence which is described by J. Hennig et al.
- RARE Rapid Acquisition Relaxation Enhanced
- the present invention provides a method of measuring T2 relaxation time constant in MRS and MRI, and creates T2 image contrast in MRI using gradient echo imaging that solves the aforementioned problems.
- the influence of magnetic field inhomogeneities on MRI signals can be removed by making use of a unique signal post-processing procedure in combination with a specially designed MRI pulse sequence without the use of refocusing RF pulses.
- This technique is based on multi-gradient-echo approach and allows obtaining a T2 contrast images in MRI without using any type of SE techniques.
- both T2 and T1 or spin density contrast images can be obtained in a single scan by adjusting flip angle and repetition time (TR).
- images corresponding to long gradient echo times in a multi-gradient-echo train can be used to form T2* contrast. Therefore, this technique allows obtaining T2, T1 or spin density, and T2* weighted images in a single scan. All such images will also be naturally co-registered which is particularly advantageous for certain clinical applications.
- the present invention can be implemented using either two dimensional or three dimensional pulse sequencing and since relatively low flip angles are used, the present invention requires substantially less RF power than SE acquisition techniques.
- the low flip angles also provide improved slice profiles as compared to traditional SE acquisition techniques.
- the present technique allows for fast imaging with repetition times (TR) on the order of 25 msec. on a typical clinical scanner, which promotes breath-held scanning to reduce motion artifacts.
- TR repetition times
- a half-Fourier approach can also be applied to increase the speed of the acquisition further.
- a magnetization preparation block can also be used to suppress lipid or CSF signals, or to enhance T1 contrast.
- a method of acquiring MR images includes determining a nonlinear function of gradient echo time to offset magnetic field inhomogeneities. Multiple sets of MR data are acquired from a series of readout gradients in a pulse sequence. The invention also includes fitting the MR data to an equation that includes the nonlinear function, and then creating T1 or spin density images, and T2 images using the results of the fitting step. The invention can also be used to create T2* images using the same data set.
- an MRI apparatus to rapidly acquire T2 weighted images that includes a magnetic resonance imaging (MRI) system having a plurality of gradient coils positioned about a bore of a magnet to impress a polarizing magnetic field.
- An RF transceiver system and an RF switch are controlled by a pulse module to transmit and receive RF signals to and from an RF coil assembly to acquire the MR images.
- the MRI apparatus also has a computer programmed to acquire multiple sets of MR data from a series of read-out gradient pulses in a pulse sequence and determine signal intensity for each MR data. The computer then fits the MR data to a signal magnitude equation that includes a nonlinear function, and then reconstructs T2 weighted MR images that are substantially free of magnetic field inhomogeneities.
- the method includes a computer program for use with an MRI apparatus that includes instructions which, when executed by a computer, cause the computer to apply a pulse sequence with a train of gradient read-out pulses and acquire MR data during the train of gradient read-out pulses.
- the program determines a nonlinear function of gradient echo time based on the object scanned and the physical characteristics of the MR apparatus.
- the program fits signal magnitudes of the MR data to a signal magnitude equation and reconstructs MR images using the results of the fit wherein the MR images reconstructed can include not only T2 weighted images, but also T1 or spin density images.
- T2* images can optionally be reconstructed using the same data set.
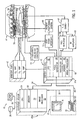
- FIG. 1 the major components of a preferred MRI system 10 incorporating the present invention are shown.
- the operation of the system is controlled from an operator console 12 which includes a keyboard or other input device 13, a control panel 14, and a display 16.
- the console 12 communicates through a link 18 with a separate computer system 20 that enables an operator to control the production and display of images on the screen 16.
- the computer system 20 includes a number of modules which communicate with each other through a backplane 20a. These include an image processor module 22, a CPU module 24 and a memory module 26, known in the art as a frame buffer for storing image data arrays.
- the computer system 20 is linked to a disk storage 28 and a tape drive 30 for storage of image data and programs, and it communicates with a separate system control 32 through a high speed serial link 34.
- the input device 13 can include a mouse, joystick, keyboard, track ball, touch screen, light wand, voice control, or similar device, and may be used for interactive geometry prescription.
- the system control 32 includes a set of modules connected together by a backplane 32a. These include a CPU module 36 and a pulse generator module 38 which connects to the operator console 12 through a serial link 40. It is through link 40 that the system control 32 receives commands from the operator which indicate the scan sequence that is to be performed.
- the pulse generator module 38 operates the system components to carry out the desired scan sequence and produces data which indicates the timing, strength and shape of the RF pulses produced, and the timing and length of the data acquisition window.
- the pulse generator module 38 connects to a set of gradient amplifiers 42, to indicate the timing and shape of the gradient pulses that are produced during the scan.
- the pulse generator module 38 also receives patient data from a physiological acquisition controller 44 that receives signals from a number of different sensors connected to the patient, such as ECG signals from electrodes attached to the patient. And finally, the pulse generator module 38 connects to a scan room interface circuit 46 which receives signals from various sensors associated with the condition of the patient and the magnet system. It is also through the scan room interface circuit 46 that a patient positioning system 48 receives commands to move the patient to the desired position for the scan.
- the gradient waveforms produced by the pulse generator module 38 are applied to the gradient amplifier system 42 having G x , G y , and G z amplifiers.
- Each gradient amplifier excites a corresponding physical gradient coil in an assembly generally designated 50 to produce the magnetic field gradients used for spatially encoding acquired signals.
- the gradient coil assembly 50 forms part of a magnet assembly 52 which includes a polarizing magnet 54 and a whole-body RF coil 56.
- a transceiver module 58 in the system control 32 produces pulses which are amplified by an RF amplifier 60 and coupled to the RF coil 56 by a transmit/receive switch 62.
- the resulting signals emitted by the excited nuclei in the patient may be sensed by the same RF coil 56 and coupled through the transmit/receive switch 62 to a preamplifier 64.
- the amplified MR signals are demodulated, filtered, and digitized in the receiver section of the transceiver 58.
- the transmit/receive switch 62 is controlled by a signal from the pulse generator module 38 to electrically connect the RF amplifier 60 to the coil 56 during the transmit mode and to connect the preamplifier 64 during the receive mode.
- the transmit/receive switch 62 also enables a separate RF coil (for example, a surface coil) to be used in either the transmit or receive mode.
- the MR signals picked up by the RF coil 56 are digitized by the transceiver module 58 and transferred to a memory module 66 in the system control 32.
- a memory module 66 in the system control 32.
- this raw k-space data is rearranged into separate k-space data arrays for each image to be reconstructed, and each of these is input to an array processor 68 which operates to Fourier transform the data into an array of image data.
- This image data is conveyed through the serial link 34 to the computer system 20 where it is stored in the disk memory 28.
- this image data may be archived on the tape drive 30, or it may be further processed by the image processor 22 and conveyed to the operator console 12 and presented on the display 16.
- the present invention can be implemented in such an MRI scanner.
- the magnet generates homogeneous magnetic field B0 in a space where the imaged subject or object is positioned.
- the field B0 polarizes spins of the protons and other nuclei that are present in the subject's body and creates longitudinal nuclear magnetization.
- the gradient coils and the generator create fast switching field gradients (G) which is an additional magnetic field along the direct of B0 with the amplitude changing linearly.
- the RF coils and RF generator transmit electromagnetic energy with frequencies in the range of the magnetic resonance frequencies corresponding to the applied magnetic field.
- the RF coils and RF receiver receive electromagnetic energy with frequencies in the range of the magnetic resonance frequencies corresponding to the applied magnetic field.
- An analog-to-digital converter digitizes analog signals and the computer system governs the operation of the above-described hardware according to a given pulse sequence.
- the computer system then stores and processes digitized magnetic resonance signals according to prior developed algorithms to produce MR images. These components are standard equipment in commercially available MRI scanners.
- the parameter R2 is the inverse of T2 and is a tissue-specific parameter that can be used to create tissue contrast and identify tissue properties. This concept prompted a broad application of spin echo (SE) techniques in diagnostic clinical applications of MRI.
- SE spin echo
- GRE gradient echo
- FID free induction decay
- Macroscopic scale refers to magnetic field changes over distances that are larger than the imaging voxel.
- Microscopic scale refers to changes in magnetic field over distances that are comparable to atomic and molecular size; that is, over distances that are orders of magnitude smaller than the voxel size.
- Mesoscopic scale refers to distances that are smaller than the voxel size, but much bigger than the atomic and molecular scale.
- Mesoscopic field inhomogeneities are tissue specific and contribute to both, tissue irreversible R2 relaxation and reversible R2'relaxation.
- a typical source of the mesoscopic field inhomogeneities in biological tissue is a blood vessel network or trabecular network.
- the present invention is directed at eliminating the influence of undesirable macroscopic effects on the desirable microscopic and mesoscopic effects.
- Macroscopic field inhomogeneities arise from magnet imperfections, body-air interface, large (compared to voxel size) sinuses inside of the body, etc. These field inhomogeneities are mostly undesirable in MR imaging because they generally provide no information of physiologic or anatomic interest. Rather, they lead to such effects as signal loss in gradient-echo imaging and image distortions in both gradient-echo and spin-echo imaging.
- the non-Lorentzian behavior of the MRI signal in Eqn. [3] is used to separate desirable information on R2 relaxation from the effects of macroscopic field inhomogeneities.
- the model for magnetic resonance signal magnitude is a generalization of the model for a single component in Eqn. [3] and is given by: where ⁇ i and R 2 i are weighted spin densities and the R2 relaxation rate constants for the i-th component. All these parameters can be extracted from the fitting procedure if a sufficient amount of data points are available from experimental data. Hence, the present invention allows separation of tissue components without the use of a multi-spin-echo approach.
- the complex magnetic resonance signal should be utilized.
- the model for this case can also be considered as a generalization of the model for a single component in Eqn. [3] and is given by: By fitting complex signals to a model in Eqn. [12], independent images of water R2 and T1 or spin density, and lipid R2 and T1 or spin density can be generated.
- the present invention then allows separation of water and lipid components in the image which is quite advantageous in practical clinical applications.
- the structure of the FID signal envelope in Eqns. [3], [11], and [12] therefore allows separation of R 2 relaxation effects from the effects of macroscopic field inhomogeneities that contaminate image information to provide a more desirable image.
- the affect of mesoscopic field inhomogeneities on magnetic resonance signals can be described as: and is used as an additional multiplication factor in Eqns. [3], [11], and [12].
- the parameter in Eqn. [13] is volume fraction occupied by deoxygenated blood and t c is a characteristic time.
- the structure of the function f is described in detail in the aforementioned Yablonskiy reference.
- the factor F meso gives small contributions to the FID signals and generally can be ignored.
- the pulse sequence 80 includes a series of RF and gradient pulses designed according to FIG.2 as described below.
- the pulse is produced by the MRI scanner 10 and applied by the RF receiving coils 56 and amplifiers 60, 64 to collect magnetic resonance signals.
- the signals are then digitized and stored in the computer memory 66 and processed according to the algorithms described herein to produce T2, T1 or spin density, and/or T2* images of the subject/object.
- images are acquired as a series of two-dimensional sections (also called slices) of the subject/object.
- Fig. 2 shows a pulse sequence designed to (1) encode information on the spatial distribution of the subject/object T2, T1 or spin density, and T2* properties; and (2) collect necessary magnetic resonance signals that may be reconstructed to produce T2, T1 or spin density, and T2* images of the subject/object.
- This pulse sequence includes Sections A-F, each designed to accomplish a certain function as described below.
- Section A of Fig. 2 is an optional preparation section. It may be employed to suppress magnetic resonance signals from lipids.
- the RF pulse 82 is a 90° pulse with frequency centered at the lipid resonance frequency. Lipid magnetization is nutated from the longitudinal to the transverse direction. Then, gradient pulses destroy or dephase this magnetization and prevent it from contributing into the image. Those skilled in the art appreciate that this is a commonly used procedure for lipid suppression.
- RF pulse 82 may also be used to suppress magnetic resonance signals from cerebral-spinal fluid (CSF).
- CSF cerebral-spinal fluid
- RF pulse 82 is a 180° inversion pulse with frequency centered at the CSF resonance frequency.
- the 180° RF pulse 82 inverts CSF magnetization from the direction parallel to B0 to the direction anti-parallel to B0.
- gradient pulses 84, 86, 88 dephase concomitant transverse magnetization that results from the imperfections in the 180° RF inversion pulse 82.
- RF and gradient pulses are followed by an inversion-waiting period (often called TI) calculated in such a way to null recovering longitudinal CSF magnetization and minimize its contribution to the image.
- TI inversion-waiting period
- the RF pulse 82 can also be used for contrast enhancement between different tissues (for example gray matter vs. white matter).
- RF pulse 82 is a 180° inversion pulse with frequency centered at the proton resonance frequency.
- An RF pulse 82 designed as such inverts tissue magnetization from the direction parallel to B0 to the direction anti-parallel to B0.
- gradient pulses 84, 86, 88 dephase concomitant transverse magnetization that results from the imperfections in the 180° RF inversion pulse 82.
- RF and gradient pulses follow the inversion-waiting period and are calculated in such a way as to maximize the difference between the longitudinal magnetization of tissues of interest. While the most commonly used procedures have been described, it is contemplated that other preparation operations can also be employed in this preparation section and are within the scope of the appending claims.
- Section B of the pulse sequence of Fig. 2 is designed to select a section in the subject/object body that is desired to be imaged.
- This section includes simultaneously applying an RF pulse 90 with flip angle ⁇ and a slice-selective gradient pulse 92.
- Such a combination nutates tissue longitudinal magnetization in a given section from the longitudinal direction by the angle ⁇ and creates transverse magnetization that can be detected by the RF coils as a magnetic resonance signal.
- this is a commonly used procedure for slice selection.
- the phase of RF pulse 90 in Section B can be alternated in a known way to reduce certain image artifacts.
- Section C includes several gradient pulses 94, 96, 98 that have several functions.
- a gradient pulse 94 is applied in the slice-selection direction Gs with an amplitude in the opposite direction to those in Section A to enhance magnetic resonance signals by rephasing back transverse magnetization created and dephased during the slice-selection procedure in Section A.
- a gradient pulse 96 is applied in the phase-encoding direction Gp (one of two orthogonal directions in the selected slice) to encode spatial information on the subject/object properties in the phase-encoding direction Gp into the magnetic resonance signals.
- Gp one of two orthogonal directions in the selected slice
- a gradient pre-pulse 98 with a certain amplitude and duration is applied in the read-out direction Gr (second of the two orthogonal directions in the selected slice) to preliminary rephase transverse magnetization in order to define the position of the first gradient echo 100 in Section D.
- the first gradient echo 100 occurs at time TE 1 and is designed such that the shaded area under the gradient pre-pulse 98 in Section C will be equal to the shaded area under the first gradient pulse 100 in Section D. This is a commonly used procedure to define the center of the gradient echo in Fourier-Transform imaging.
- Section D of the pulse sequence of Fig. 2 includes a series of N fast switching gradient pulses 102 (i.e., a gradient-pulse train) in the read-out direction Gr.
- Each of the gradient pulses in this train 102 is designed to form a gradient-echo 104 in the magnetic resonance signals.
- N gradient pulses produce N gradient echoes, wherein the N-th echo in the train occurs during the N-th gradient pulse.
- the center of the N-th echo corresponds to the time TE N elapsed from the center of the RF excitation pulse 90 in Section B.
- a total of N magnetic resonance signals, or gradient echoes 104, are collected, digitized, and stored during this period.
- Each digitized gradient-echo signal contains Nr points, with Nr is the image resolution in the read-out direction Gr. Because each signal is collected in the presence of the read-out gradient 102, it bears spatial information on the subject/object in the read-out direction Gr.
- the structure of gradient pulses 102 and the signal sampling rate can be calculated according to the general rules that are known to those who are skilled in the art.
- one line of 2D image k-space data along the read-out direction Gr is covered for each of the N gradient echoes 104.
- Section E is designed to destroy residual transverse magnetization. Any of the standard techniques such as gradient spoiling or RF spoiling can be utilized. Those skilled in the art appreciate that these are well known and commonly used procedures.
- Section F is a waiting period designed to restore longitudinal magnetization in a given slice. During this period, no RF pulses are applied to a given slice allowing recovery of the longitudinal magnetization due to the T1 relaxation processes.
- the pulse sequence 80 with Sections A through F is repeated Np times, where Np is the image resolution in the phase-encoding direction Gp.
- Np is the image resolution in the phase-encoding direction Gp.
- the phase-encoding gradient 96 should be incremented by a certain calculated amount to achieve full coverage of the image k-space. Results of this procedure is N covered k-space data sets corresponding to N gradient echoes 104 where the N-th gradient echo is centered at the gradient echo time TE N .
- ⁇ n (x,y,z) and ⁇ n (x,y,z) are image intensity and phase for a slice at the position z, respectively
- x and y are image spatial coordinates in the read-out Gr and phase-encoding Gp directions.
- z 1 for a single slice acquisition.
- Section F can be used to collect magnetic resonance signals from other slices by subjecting them to the procedures described above in Section A-E.
- This collection of data is known as 2D multi-slice interleaved imaging - a procedure substantially reducing imaging time.
- the data is analyzed on a pixel-by-pixel basis to produce T2 and either T1 or spin density and T2* weighted images.
- the magnitude of the signal is then fit to Eqn.
- R2 ( x,y,z ) and S ( x,y,z ; 0 ) are produced according to the algorithms described in Eqns. [5], and [6]. If more complicated models, such as in Eqns. [11] and [12] are used, then R2 ( x,y,z ) and S ( x,y,z ; 0 ) images may be produced for each of the compartments in the tissue.
- the image S ( x,y ; 0 ) may represent either a spin-density image or a T1 weighted image depending on the relationship between the parameters used in the pulse sequence, mainly repetition time TR and flip angle ⁇ .
- the gradient echo images that are collected during the positive and negative read-out gradient pulses 102 of Section D may be distorted differently due to the presence of macroscopic field inhomogeneities.
- One of the image correction procedures known to those skilled in the art, can be applied to each image prior to pixel-by-pixel analysis described above, or two series of images in the echo-train (one collected in the positive gradients and another in the negative gradients) can be analyzed independently before combining in the resultant image.
- a pulse sequence 110 designed according to Fig. 3 and described below, is produced by the MRI scanner 10 and applied by the RF receiving coils 56 and amplifiers 60, 64 to collect magnetic resonance signals.
- the signals are then digitized and stored in the computer memory 66 and processed according to the algorithms herein described to produce T2, T1 or spin density, and T2* images of the subject/object.
- images are acquired as three-dimensional views of a thick slab from the subject/object.
- Fig. 3 shows a pulse sequence 110 designed to (1) encode information on the spatial distribution of the subject/object with T2, T1 or spin density, and T2* properties; and to (2) collect necessary magnetic resonance signals that may be reconstructed to produce T2, T1 or spin density, and/or T2* images of the subject/object.
- the pulse sequence 110 includes six sections A-F, as in Fig. 2. As is evident, most of the 3-D pulse sequence 110 of Fig. 3 is similar to the 2-D pulse sequence 80 of Fig. 2 with similar function as described with reference to Fig. 2. For example, Section A includes an optional RF pulse 112 which can be designed similarly to that described with reference to Fig. 2.
- Section B includes RF pulse 120 and a slice-selective gradient pulse 122, both of which have been described with reference to Fig. 2.
- Section C of the 3-D pulse sequence 110 of Fig. 3 includes three gradient pulses 124, 126, and 128.
- the gradient pulse 124 is a 3-D phase encoding gradient pulse and is applied in the slab-selective direction Gs.
- the gradient pulse 124 is applied in a direction perpendicular to the plane of the selected slab to encode spatial information on the subject/object into the magnetic resonance signal.
- a phase encoding gradient pulse 126 is applied in the phase encoding direction Gp and gradient prepulse 128 is applied in the read-out direction Gr.
- the gradient prepulse 128 is designed to preliminarily rephase transverse magnetization in order to define the position of the first gradient echo 130 of Section D which includes a series of fast switching gradient pulses 132 (i.e., the gradient pulse train). As previously described, if there are N gradient pulses in the train 132, there are N gradient echoes 134 from echo time TE 1 to TE N .
- the read-out gradient pulses 132 and the gradient echoes 134 are followed by Section E which can include gradients or RF spoiling to destroy residual transverse magnetization. Also as previously described, Section F is simply a waiting period designed to restore longitudinal magnetization in a given slab.
- the entire pulse sequence 110 is repeated Np x Ns times, where Np is the image resolution in the phase-encoding direction and Ns is the image resolution in the slab-selection direction.
- Np is the image resolution in the phase-encoding direction
- Ns is the image resolution in the slab-selection direction.
- the 3D and 2D phase-encoding gradients 124, 126 should be incremented by a certain calculated amount to achieve full coverage of the 3D image k-space.
- the results of this procedure is N 3D k-space data sets corresponding to N gradient echoes 134 where the Nth gradient echo is centered at the gradient echo time TE N .
- ⁇ n (x, y, z ) and ⁇ n ( x, y, z ) are the image intensity and phase corresponding to x , y and z in the read-out, phase-encoding and slab-selection directions.
- the data is analyzed on a voxel-by-voxel basis to produce T2 and T1 or spin density weighted images.
- the magnitude of the signal is then fit to Eqn.
- R2 ( x,y,z ) and S ( x , y , z ; 0 ) are produced according to the algorithms described in Eqns. [5] and [6]. If more complicated models, such as in Eqns. [11] and [12] are used, then R2 ( x , y , z ) and S ( x , y , z ; 0 ) images may be produced for each of the compartments in the tissue.
- the image S ( x,y,z ; 0 ) may represent either a spin-density image or a T1 weighted image depending on the relationship between the parameters used in the pulse sequence, mainly repetition time TR and flip angle ⁇ .
- Images acquired at the end of the echo-train 134 that correspond to long gradient echo times TE are T2* weighted.
- T2' images can also be produced. Accordingly, this imaging technique can produce T2, T1 or spin density, T2* or T2' weighted 3D images of the object/subject. Because all these images result from the analysis of the same data set, they are also naturally co-registered.
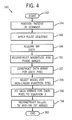
- a flow chart of the aforementioned algorithm 140 is shown.
- the pulse sequences 146 is applied and MR data is acquired at 148.
- the data arrays are constructed for each pixel 152 and the system selects a model for the nonlinear function F(TE) 154.
- the data arrays are then fit to Eqn. [3] 156 and the system is able to reconstruct the images S(x, y, z; 0), T2, T2*, or T2' from the same data set.
- the present invention was tested using the 2-D multi-slice multi-gradient echo imaging pulse sequence of Fig. 2 on a 1.5 Tesla whole body MRI scanner without any preparation pulses. Eleven images of a NiSO 4 doped water phantom were acquired. The inter-echo time was 3.2 msec, TR was 40 msec with a matrix of 128x128. Acquisition time was complete in 6 seconds.
- R2 maps were obtained by fitting time domain data of signal intensity on a pixel by pixel basis to Eqn. [3] with Gaussian F(TE) from Eqn. [9]. The resultant R2 map was largely flat except for a pixel-size layer near the phantom surface.
- the average R2 was 12.7 sec -1 with a variation of 2% which was in agreement with the R2 value of (12.6 ⁇ 0.1) sec -1 obtained with a double-spin echo technique that has been a standard acquisition technique.
- SE spin echo
- the present invention provides a new technique for measuring T2 relaxation rate constant in MRS and MRI, and creating T2 image contrast in MRI.
- the technique is based on multi-gradient-echo approach and allows obtaining a T2 contrast in MRI without exploitation of any SE techniques. Furthermore, it has the additional advantages of obtaining of T2, T1 or spin density, and T2* weighted images in a single scan. All these images are also naturally co-registered.
- both 3D and multi-slice 2D versions can be implemented. This approach requires substantially less RF power compared to SE approaches and allows for fast imaging with repetition time (TR) on the order of 25 msec on a typical clinical scanner.
- TR repetition time
- 2D or 3D images corresponding to different gradient echo times TE can be collected by means of a spiral scanning technique instead the Fourier Transform Imaging technique discussed herein. Data may then be arranged according to Eqns. [15], and [17] and analyzed using the same algorithms as previously discussed to provide T2, T1 or spin density, T2*, or T2' weighted images.
- the present invention includes a method of acquiring MR images that includes acquiring multiple sets of MR data from our series of readout gradient pulses in a pulse sequence and determining a nonlinear function of gradient echo time F(TE) to offset magnetic field inhomogeneities.
- the method also includes fitting the MR data to an equation that includes the nonlinear function F(TE) in Eq. [3] and creating at least S(x, y, z;0) and T2(x,y,z) images using the results of the fitting step. If additional nonlinear function F meso (TE) in Eq. [13] is used, the invention allows creating images that give information on tissue blood volume and blood oxygenation level.
- the invention also includes an MRI apparatus to rapidly acquire T2 weighted MR images using gradient echo imaging that includes a magnetic resonance imaging (MRI) system having a plurality of gradient coils positioned about a bore of a magnet to impress a polarizing magnetic field.
- the MRI system also includes an RF transceiver system and an RF switch controlled by a pulse module to transmit RF signals to an RF coil assembly to acquire the MR images.
- the apparatus includes a computer programmed to acquire multiple sets of MR data from a series of read-out gradient pulses in a pulse sequence and determine signal intensity for each MR data.
- the computer is also programmed to fit the MR data to a signal magnitude equation that includes a nonlinear function. T2 weighted MR images are then reconstructed that are substantially free of magnetic field inhomogeneities.
- the invention also includes a computer program for use with an MRI apparatus that includes instructions which, when executed by a computer, cause the computer to apply a pulse sequence with a train of gradient read-out pulses and acquire MR data during the train of gradient read-out pulses.
- the computer program also determines a nonlinear function of gradient echo time and fits signal magnitudes of the MR data to a signal magnitude equation.
- the program can then reconstruct MR images using results of the equation fit wherein the MR images reconstructed can include S (x,y,z;0) and T2(x,y,z) weighted images.
Abstract
Description
- The present invention relates generally to the field of Magnetic Resonance Imaging (MRI) and Magnetic Resonance Spectroscopy (MRS), and more particularly, to a method and apparatus for gradient echo MR imaging to measure a T2 relaxation rate constant and/or to create T2 contrast images together with T1 or spin density and T2* weighted images, all from the same MR data set.
- When a substance such as human tissue is subjected to a uniform magnetic field (polarizing field B0), the individual magnetic moments of the spins in the tissue attempt to align with this polarizing field, but precess about it in random order at their characteristic Larmor frequency. If the substance, or tissue, is subjected to a magnetic field (excitation field B1) which is in the x-y plane and which is near the Larmor frequency, the net aligned moment, or "longitudinal magnetization", MZ, may be rotated, or "tipped", into the x-y plane to produce a net transverse magnetic moment Mt. A signal is emitted by the excited spins after the excitation signal B1 is terminated and this signal may be received and processed to form an image.
- When utilizing these signals to produce images, magnetic field gradients (Gx Gy and Gz) are employed. Typically, the region to be imaged is scanned by a sequence of measurement cycles in which these gradients vary according to the particular localization method being used. The resulting set of received NMR signals are digitized and processed to reconstruct the image using one of many well-known reconstruction techniques.
- One of the problems with acquiring T2 weighted images is that conventional techniques require a relatively long repetition time (TR ) in order to achieve a pure T2 (proton density) image contrast. In other words, T2 weighted imaging is generally associated with long imaging times, as compared to T1 weighted imaging. T1 imaging is much faster since such imaging is achieved by shortening the repetition time.
- Measuring T2 relaxation time in MRI or MRS, as well as creating T2 contrast in MRI typically requires use of a version of spin echo (SE) pulse sequences. These sequences can differ in how signal excitation, phase encoding, and acquisition are combined together to form a pulse sequence. Different pulse sequences result in different image acquisition times, signal-to-noise (SNR) ratios and image contrasts. The most frequently used sequences for clinical diagnostic applications are traditional multi-slice two-dimensional Fourier Transform SE sequences and single-slice fast spin echo sequence techniques such as the Rapid Acquisition Relaxation Enhanced (RARE) sequence which is described by J. Hennig et al. in an article in Magnetic Resonance in Medicine 3,823-833 (1986) entitled "RARE Imaging: A Fast Imaging Method for Clinical MR." The former usually requires long acquisition times, on the order of minutes, and the latter represents a fast imaging approach where only a single slice can be acquired in a subsecond time scale. The common attribute of all SE techniques is the presence of refocusing RF pulses. Most often, 180° RF pulses are used. The major reason to use SE techniques stems from the refocusing nature of the 180° RF pulses, which substantially reduces the influence of unwanted magnetic field inhomogeneities on MRI signals. These approaches can suffer from motion artifacts and imperfections in slice profiles resulting from the presence of the 180° refocusing pulses. More importantly, however, SE techniques suffer from restrictions on RF power deposition. This factor substantially limits the clinical application of these techniques for high-field MR imaging.
- It would therefore be desirable to have a method and apparatus capable of creating T2 contrast images using gradient echo imaging to acquire T2 contrast images in a time that approximates T1 imaging. It would also be advantageous to be able to use the same MR data that is used to construct the T2 weighted images to construct T1 or spin density images, and T2* weighted images.
- The present invention provides a method of measuring T2 relaxation time constant in MRS and MRI, and creates T2 image contrast in MRI using gradient echo imaging that solves the aforementioned problems. In accordance with the present invention, the influence of magnetic field inhomogeneities on MRI signals can be removed by making use of a unique signal post-processing procedure in combination with a specially designed MRI pulse sequence without the use of refocusing RF pulses.
- This technique is based on multi-gradient-echo approach and allows obtaining a T2 contrast images in MRI without using any type of SE techniques. Through use of the present invention, both T2 and T1 or spin density contrast images can be obtained in a single scan by adjusting flip angle and repetition time (TR). Further, images corresponding to long gradient echo times in a multi-gradient-echo train can be used to form T2* contrast. Therefore, this technique allows obtaining T2, T1 or spin density, and T2* weighted images in a single scan. All such images will also be naturally co-registered which is particularly advantageous for certain clinical applications.
- The present invention can be implemented using either two dimensional or three dimensional pulse sequencing and since relatively low flip angles are used, the present invention requires substantially less RF power than SE acquisition techniques. The low flip angles also provide improved slice profiles as compared to traditional SE acquisition techniques. The present technique allows for fast imaging with repetition times (TR) on the order of 25 msec. on a typical clinical scanner, which promotes breath-held scanning to reduce motion artifacts. A half-Fourier approach can also be applied to increase the speed of the acquisition further.
- Application of the present invention provides images that are largely insensitive to RF field inhomogeneities and also allows separation of water and lipid contributions in an image. A magnetization preparation block can also be used to suppress lipid or CSF signals, or to enhance T1 contrast.
- A method of acquiring MR images, according to the present invention, includes determining a nonlinear function of gradient echo time to offset magnetic field inhomogeneities. Multiple sets of MR data are acquired from a series of readout gradients in a pulse sequence. The invention also includes fitting the MR data to an equation that includes the nonlinear function, and then creating T1 or spin density images, and T2 images using the results of the fitting step. The invention can also be used to create T2* images using the same data set.
- In accordance with another aspect of the invention, an MRI apparatus is disclosed to rapidly acquire T2 weighted images that includes a magnetic resonance imaging (MRI) system having a plurality of gradient coils positioned about a bore of a magnet to impress a polarizing magnetic field. An RF transceiver system and an RF switch are controlled by a pulse module to transmit and receive RF signals to and from an RF coil assembly to acquire the MR images. The MRI apparatus also has a computer programmed to acquire multiple sets of MR data from a series of read-out gradient pulses in a pulse sequence and determine signal intensity for each MR data. The computer then fits the MR data to a signal magnitude equation that includes a nonlinear function, and then reconstructs T2 weighted MR images that are substantially free of magnetic field inhomogeneities.
- In order to reconstruct the T2 weighted images, the method includes a computer program for use with an MRI apparatus that includes instructions which, when executed by a computer, cause the computer to apply a pulse sequence with a train of gradient read-out pulses and acquire MR data during the train of gradient read-out pulses. The program determines a nonlinear function of gradient echo time based on the object scanned and the physical characteristics of the MR apparatus. The program then fits signal magnitudes of the MR data to a signal magnitude equation and reconstructs MR images using the results of the fit wherein the MR images reconstructed can include not only T2 weighted images, but also T1 or spin density images. T2* images can optionally be reconstructed using the same data set.
- Various other features, objects and advantages of the present invention will be made apparent from the following detailed description and the drawings.
- The drawings illustrate one embodiment presently contemplated for carrying out the invention.
- In the drawings:
- Fig. 1 is a schematic block diagram of an NMR imaging system for use with the present invention.
- Fig. 2 is a timing diagram depicting a pulse sequence for two-dimensional multi-slice imaging in accordance with the present invention.
- Fig. 3 is a timing diagram depicting a pulse sequence for three-dimensional imaging in accordance with the present invention.
- Fig. 4 is a flow chart showing an implementation of the present invention for use with the system of Fig. 1.
-
- Referring to Fig. 1, the major components of a preferred
MRI system 10 incorporating the present invention are shown. The operation of the system is controlled from anoperator console 12 which includes a keyboard orother input device 13, acontrol panel 14, and adisplay 16. Theconsole 12 communicates through alink 18 with aseparate computer system 20 that enables an operator to control the production and display of images on thescreen 16. Thecomputer system 20 includes a number of modules which communicate with each other through a backplane 20a. These include animage processor module 22, aCPU module 24 and amemory module 26, known in the art as a frame buffer for storing image data arrays. Thecomputer system 20 is linked to adisk storage 28 and atape drive 30 for storage of image data and programs, and it communicates with aseparate system control 32 through a highspeed serial link 34. Theinput device 13 can include a mouse, joystick, keyboard, track ball, touch screen, light wand, voice control, or similar device, and may be used for interactive geometry prescription. - The
system control 32 includes a set of modules connected together by abackplane 32a. These include aCPU module 36 and apulse generator module 38 which connects to theoperator console 12 through aserial link 40. It is throughlink 40 that thesystem control 32 receives commands from the operator which indicate the scan sequence that is to be performed. Thepulse generator module 38 operates the system components to carry out the desired scan sequence and produces data which indicates the timing, strength and shape of the RF pulses produced, and the timing and length of the data acquisition window. Thepulse generator module 38 connects to a set ofgradient amplifiers 42, to indicate the timing and shape of the gradient pulses that are produced during the scan. Thepulse generator module 38 also receives patient data from aphysiological acquisition controller 44 that receives signals from a number of different sensors connected to the patient, such as ECG signals from electrodes attached to the patient. And finally, thepulse generator module 38 connects to a scanroom interface circuit 46 which receives signals from various sensors associated with the condition of the patient and the magnet system. It is also through the scanroom interface circuit 46 that apatient positioning system 48 receives commands to move the patient to the desired position for the scan. - The gradient waveforms produced by the
pulse generator module 38 are applied to thegradient amplifier system 42 having Gx, Gy, and Gz amplifiers. Each gradient amplifier excites a corresponding physical gradient coil in an assembly generally designated 50 to produce the magnetic field gradients used for spatially encoding acquired signals. Thegradient coil assembly 50 forms part of amagnet assembly 52 which includes apolarizing magnet 54 and a whole-body RF coil 56. Atransceiver module 58 in thesystem control 32 produces pulses which are amplified by anRF amplifier 60 and coupled to theRF coil 56 by a transmit/receive switch 62. The resulting signals emitted by the excited nuclei in the patient may be sensed by thesame RF coil 56 and coupled through the transmit/receive switch 62 to apreamplifier 64. The amplified MR signals are demodulated, filtered, and digitized in the receiver section of thetransceiver 58. The transmit/receive switch 62 is controlled by a signal from thepulse generator module 38 to electrically connect theRF amplifier 60 to thecoil 56 during the transmit mode and to connect thepreamplifier 64 during the receive mode. The transmit/receive switch 62 also enables a separate RF coil (for example, a surface coil) to be used in either the transmit or receive mode. - The MR signals picked up by the
RF coil 56 are digitized by thetransceiver module 58 and transferred to amemory module 66 in thesystem control 32. When a scan is completed, an array of raw k-space data has been acquired in thememory module 66. As will be described in more detail below, this raw k-space data is rearranged into separate k-space data arrays for each image to be reconstructed, and each of these is input to anarray processor 68 which operates to Fourier transform the data into an array of image data. This image data is conveyed through theserial link 34 to thecomputer system 20 where it is stored in thedisk memory 28. In response to commands received from theoperator console 12, this image data may be archived on thetape drive 30, or it may be further processed by theimage processor 22 and conveyed to theoperator console 12 and presented on thedisplay 16. - The present invention can be implemented in such an MRI scanner. In general, the magnet generates homogeneous magnetic field B0 in a space where the imaged subject or object is positioned. The field B0 polarizes spins of the protons and other nuclei that are present in the subject's body and creates longitudinal nuclear magnetization. The gradient coils and the generator create fast switching field gradients (G) which is an additional magnetic field along the direct of B0 with the amplitude changing linearly. The RF coils and RF generator transmit electromagnetic energy with frequencies in the range of the magnetic resonance frequencies corresponding to the applied magnetic field. The RF coils and RF receiver receive electromagnetic energy with frequencies in the range of the magnetic resonance frequencies corresponding to the applied magnetic field. An analog-to-digital converter digitizes analog signals and the computer system governs the operation of the above-described hardware according to a given pulse sequence. The computer system then stores and processes digitized magnetic resonance signals according to prior developed algorithms to produce MR images. These components are standard equipment in commercially available MRI scanners.
- It is known to those skilled in the art that NMR/MRI signals acquired with spin echo sequences at spin echo time TEse, experience exponential decay that is characterized by an R2 relaxation rate constant:
- The parameter R2 is the inverse of T2 and is a tissue-specific parameter that can be used to create tissue contrast and identify tissue properties. This concept prompted a broad application of spin echo (SE) techniques in diagnostic clinical applications of MRI.
- Another family of relevant MRI techniques that found applications in diagnostic radiology is based on gradient echo (GRE) imaging when free induction decay (FID) signals are acquired instead of SE signals. A major disadvantage of GRE-based techniques is their susceptibility to magnetic field inhomogeneity effects that adversely affect NMR/MRI signals. Some of these effects resulting from macroscopic field inhomogeneities are not tissue specific, but arise from magnet imperfections, tissue-air interfaces, etc. Therefore, a resulting MR image may have artifacts that preclude its usefulness. Removing macroscopic field inhomogeneity effects from the MRI image is thus quite desirable.
- It was traditionally assumed that after excitation, NMR/MRI signals decay with Gradient Echo time TE as a linear exponential (Lorentzian) function:
- However, the general assumption that the FID signal decays, as a linear exponential as in Eqn. 2, is incorrect. This conclusion is based on the following line of consideration and as further set forth in an article published in Magnetic Resonance in Medicine, Vol. 39, pp. 417-428 (1998) entitled: Quantitation of Instrinsic Magnetic Susceptibility-Related Effects in a Tissue Matrix. Phantom Study by Dmitriy A. Yablonskiy (hereinafter "Yablonskiy, 1998").
- In practice the magnetic field inside of an MRI scanner is always inhomogeneous. The relative scale of this inhomogeneity compared to an imaging voxel can roughly be divided into three categories: macroscopic, mesoscopic and microscopic. Macroscopic scale refers to magnetic field changes over distances that are larger than the imaging voxel. Microscopic scale refers to changes in magnetic field over distances that are comparable to atomic and molecular size; that is, over distances that are orders of magnitude smaller than the voxel size. Mesoscopic scale refers to distances that are smaller than the voxel size, but much bigger than the atomic and molecular scale.
- All these inhomogeneities affect MRI signal formation. Fluctuating microscopic field inhomogeneities lead to the irreversible signal dephasing characterized by the T2=1/R2 relaxation time constant, and changes in the longitudinal magnetization characterized by the T relaxation time constant. Exploitation of T1 and T2 effects provide the basis for tissue identification in MRI.
- Mesoscopic field inhomogeneities are tissue specific and contribute to both, tissue irreversible R2 relaxation and reversible R2'relaxation. A typical source of the mesoscopic field inhomogeneities in biological tissue is a blood vessel network or trabecular network. The present invention is directed at eliminating the influence of undesirable macroscopic effects on the desirable microscopic and mesoscopic effects.
- Macroscopic field inhomogeneities arise from magnet imperfections, body-air interface, large (compared to voxel size) sinuses inside of the body, etc. These field inhomogeneities are mostly undesirable in MR imaging because they generally provide no information of physiologic or anatomic interest. Rather, they lead to such effects as signal loss in gradient-echo imaging and image distortions in both gradient-echo and spin-echo imaging.
- As set forth in the aforementioned publication by Yablonskiy, 1998, FID signal decay, due to macroscopic field inhomogeneities, cannot be described as a linear exponential (Lorentzian) function as in Eqn. 2. Given this consideration, the magnitude of the FID signal can be presented as follows:
- In this invention, the non-Lorentzian behavior of the MRI signal in Eqn. [3] is used to separate desirable information on R2 relaxation from the effects of macroscopic field inhomogeneities. Fitting an FID signal to the following equation:
- Implementation of this fitting procedure requires knowledge of the function F(TE). The exact calculation for the function F(TE) requires prior information of the macroscopic magnetic field distribution in a voxel. However, if this information is not available, F(TE) can be approximated. Taking into consideration that F(TE) is an even function of TE and that F(0) = 1, the most general solution to the problem is to expand F(TE) to a general series:
- However, other model functions can also be considered. When macroscopic magnetic field inhomogeneities arise from large (compared to an imaging voxel size) objects, located outside of the voxel, magnetic field inhomogeneities may be well described in each given voxel by means of a constant magnetic field gradient
G , which is different for different voxels. If that is the case, then the function F(TE) can be represented by a simple sinc-function:G . This expression is an approximation assuming that the voxel is a rectangle in the direction ofG . It is noted that Eqn. [10] only depends on one phenomenological parameter, Δω. - If the field inhomogeneity is small enough that the argument Δω · TE / 2 remains small for all gradient echoes in the sequence train, a Gaussian approximation in Eqn.[9] is sufficient to properly account for the macroscopic field inhomogeneities. The accuracy of such an approximation may be estimated by comparing Eqn. [10] with Eqn. [9]. If the phase dispersion, ϕ, accumulated across the voxel during the maximum dephasing time (TE max) satisfies the criterion ϕ < π / 2, then a simple numerical estimation shows that the maximum difference between the full expression for F(TE), Eqn. [10], and its Gaussian approximation, Eqn. [9], is only 2%. In practice, the maximal phase dispersion across a voxel can be made much smaller than π / 2 by local shimming and/or reducing the voxel size. For TE max = 50 msec. for example, this criterion requires that the field inhomogeneity across the voxel should be less than 5 Hz. For static field strength of 1.5 T, this corresponds to about 0.1 ppm/voxel. With current whole body imaging systems this homogeneity can be easily achieved even for voxels as large as 1 cm x 1 cm x 1 cm assuming that no macroscopic air cavities are present inside of or close to the voxel.
- In a more complicated case of several tissue components with different relaxation rate constants in a given voxel, the model for magnetic resonance signal magnitude is a generalization of the model for a single component in Eqn. [3] and is given by:where ρi and R2 i are weighted spin densities and the R2 relaxation rate constants for the i-th component. All these parameters can be extracted from the fitting procedure if a sufficient amount of data points are available from experimental data. Hence, the present invention allows separation of tissue components without the use of a multi-spin-echo approach.

- If a lipid component is present in a voxel, then the complex magnetic resonance signal should be utilized. The model for this case can also be considered as a generalization of the model for a single component in Eqn. [3] and is given by:By fitting complex signals to a model in Eqn. [12], independent images of water R2 and T1 or spin density, and lipid R2 and T1 or spin density can be generated. The present invention then allows separation of water and lipid components in the image which is quite advantageous in practical clinical applications.

- The structure of the FID signal envelope in Eqns. [3], [11], and [12] therefore allows separation of R2 relaxation effects from the effects of macroscopic field inhomogeneities that contaminate image information to provide a more desirable image.
- The affect of mesoscopic field inhomogeneities on magnetic resonance signals can be described as:and is used as an additional multiplication factor in Eqns. [3], [11], and [12]. The parameter
 in Eqn. [13] is volume fraction occupied by deoxygenated blood and tc is a characteristic time. The structure of the function f is described in detail in the aforementioned Yablonskiy reference. The R2' relaxation rate constant is R2' =
 /tc and R2* relaxation rate constant has contributions from both R2 and R2' relaxation rates: R2*=R2+R2'. In many cases, the factor Fmeso gives small contributions to the FID signals and generally can be ignored. However, if desirable, it can be included in the above described fitting procedure to extract information on T2', T2* images, and tissue-specific characteristics, such as blood volume and blood oxygenation level as described in the aforementioned Yablonskiy reference. On the other hand, for gradient echo times TE shorter than the characteristic time 1.5tc , the contribution of mesoscopic field inhomogeneities is Gaussian. This characteristic time has been estimated to be on the order of 20-25 msec at 1.5T if the source of mesoscopic field inhomogeneities was a blood vessel network. If the magnetic resonance signal sampling is restricted to TE < 1.5tc , the influence of mesoscopic field inhomogeneities will be described by a Gaussian term in Eqn. [9] and will not influence evaluation of tissue T2 relaxation rate constant.
- It is known to those skilled in the art that the presence of macroscopic field inhomogeneities - field gradients across the voxel, may result in the shift of the center of the gradient echoes and subsequent signal loss. This effect can also be included in the function F(TE) and effectively removed from the image by this fitting procedure. As noted in the aforementioned Yablonskiy reference, this signal loss is a quadratic function of the gradient echo time TE and can be approximated by one of the model functions in Eqns. [8] or [9].
- Referring now to Fig. 2, a two-dimensional multi-slice multi-gradient echo imaging pulse sequence is shown. The
pulse sequence 80 includes a series of RF and gradient pulses designed according to FIG.2 as described below. The pulse is produced by theMRI scanner 10 and applied by the RF receiving coils 56 andamplifiers computer memory 66 and processed according to the algorithms described herein to produce T2, T1 or spin density, and/or T2* images of the subject/object. In this particular embodiment, images are acquired as a series of two-dimensional sections (also called slices) of the subject/object. - Fig. 2 shows a pulse sequence designed to (1) encode information on the spatial distribution of the subject/object T2, T1 or spin density, and T2* properties; and (2) collect necessary magnetic resonance signals that may be reconstructed to produce T2, T1 or spin density, and T2* images of the subject/object. This pulse sequence includes Sections A-F, each designed to accomplish a certain function as described below.
- Section A of Fig. 2 is an optional preparation section. It may be employed to suppress magnetic resonance signals from lipids. In this case, the
RF pulse 82 is a 90° pulse with frequency centered at the lipid resonance frequency. Lipid magnetization is nutated from the longitudinal to the transverse direction. Then, gradient pulses destroy or dephase this magnetization and prevent it from contributing into the image. Those skilled in the art appreciate that this is a commonly used procedure for lipid suppression. -
RF pulse 82 may also be used to suppress magnetic resonance signals from cerebral-spinal fluid (CSF). In this case,RF pulse 82 is a 180° inversion pulse with frequency centered at the CSF resonance frequency. The 180°RF pulse 82 inverts CSF magnetization from the direction parallel to B0 to the direction anti-parallel to B0. Followinggradient pulses RF inversion pulse 82. RF and gradient pulses are followed by an inversion-waiting period (often called TI) calculated in such a way to null recovering longitudinal CSF magnetization and minimize its contribution to the image. Those skilled in the art appreciate that this is a commonly used procedure for CSF suppression. - The
RF pulse 82 can also be used for contrast enhancement between different tissues (for example gray matter vs. white matter). In this case,RF pulse 82 is a 180° inversion pulse with frequency centered at the proton resonance frequency. AnRF pulse 82 designed as such inverts tissue magnetization from the direction parallel to B0 to the direction anti-parallel to B0. Followinggradient pulses RF inversion pulse 82. RF and gradient pulses follow the inversion-waiting period and are calculated in such a way as to maximize the difference between the longitudinal magnetization of tissues of interest. While the most commonly used procedures have been described, it is contemplated that other preparation operations can also be employed in this preparation section and are within the scope of the appending claims. - Section B of the pulse sequence of Fig. 2 is designed to select a section in the subject/object body that is desired to be imaged. This section includes simultaneously applying an
RF pulse 90 with flip angle α and a slice-selective gradient pulse 92. Such a combination nutates tissue longitudinal magnetization in a given section from the longitudinal direction by the angle α and creates transverse magnetization that can be detected by the RF coils as a magnetic resonance signal. Those skilled in the art appreciate that this is a commonly used procedure for slice selection. Also, the phase ofRF pulse 90 in Section B can be alternated in a known way to reduce certain image artifacts. - Section C includes
several gradient pulses gradient pulse 94 is applied in the slice-selection direction Gs with an amplitude in the opposite direction to those in Section A to enhance magnetic resonance signals by rephasing back transverse magnetization created and dephased during the slice-selection procedure in Section A. Agradient pulse 96, with a certain amplitude and duration, is applied in the phase-encoding direction Gp (one of two orthogonal directions in the selected slice) to encode spatial information on the subject/object properties in the phase-encoding direction Gp into the magnetic resonance signals. Those skilled in the art appreciate that this is a commonly used procedure in 2D Fourier-Transform imaging. - A
gradient pre-pulse 98, with a certain amplitude and duration is applied in the read-out direction Gr (second of the two orthogonal directions in the selected slice) to preliminary rephase transverse magnetization in order to define the position of thefirst gradient echo 100 in Section D. Thefirst gradient echo 100 occurs at time TE1 and is designed such that the shaded area under thegradient pre-pulse 98 in Section C will be equal to the shaded area under thefirst gradient pulse 100 in Section D. This is a commonly used procedure to define the center of the gradient echo in Fourier-Transform imaging. - Section D of the pulse sequence of Fig. 2 includes a series of N fast switching gradient pulses 102 (i.e., a gradient-pulse train) in the read-out direction Gr. Each of the gradient pulses in this
train 102 is designed to form a gradient-echo 104 in the magnetic resonance signals. N gradient pulses produce N gradient echoes, wherein the N-th echo in the train occurs during the N-th gradient pulse. The center of the N-th echo corresponds to the time TEN elapsed from the center of theRF excitation pulse 90 in Section B. A total of N magnetic resonance signals, or gradient echoes 104, are collected, digitized, and stored during this period. Each digitized gradient-echo signal contains Nr points, with Nr is the image resolution in the read-out direction Gr. Because each signal is collected in the presence of the read-outgradient 102, it bears spatial information on the subject/object in the read-out direction Gr. The structure ofgradient pulses 102 and the signal sampling rate can be calculated according to the general rules that are known to those who are skilled in the art. During this step, one line of 2D image k-space data along the read-out direction Gr is covered for each of the N gradient echoes 104. - Section E is designed to destroy residual transverse magnetization. Any of the standard techniques such as gradient spoiling or RF spoiling can be utilized. Those skilled in the art appreciate that these are well known and commonly used procedures.
- Section F is a waiting period designed to restore longitudinal magnetization in a given slice. During this period, no RF pulses are applied to a given slice allowing recovery of the longitudinal magnetization due to the T1 relaxation processes.
- To collect information necessary to reconstruct images, the
pulse sequence 80 with Sections A through F is repeated Np times, where Np is the image resolution in the phase-encoding direction Gp. Those skilled in the art will appreciate that during each such repetition, the phase-encoding gradient 96 should be incremented by a certain calculated amount to achieve full coverage of the image k-space. Results of this procedure is N covered k-space data sets corresponding to N gradient echoes 104 where the N-th gradient echo is centered at the gradient echo time TEN. A two-dimensional Fourier transform of each of the k-space data sets results in N complex images for each slice at the position z: - It is known that the noise in the images can be reduced by repeatedly collecting the same line in the k-space and averaging the complex data. The waiting period in Section F can be used to collect magnetic resonance signals from other slices by subjecting them to the procedures described above in Section A-E. This collection of data is known as 2D multi-slice interleaved imaging - a procedure substantially reducing imaging time.
- After N images of each slice are obtained, the data is analyzed on a pixel-by-pixel basis to produce T2 and either T1 or spin density and T2* weighted images. To do so, for each pixel (x,y) in each slice z, a data array is formed and assigned to the magnetic resonance signal as a function of time TE:
- The gradient echo images that are collected during the positive and negative read-out
gradient pulses 102 of Section D, may be distorted differently due to the presence of macroscopic field inhomogeneities. There are at least two ways to deal with this problem. One of the image correction procedures, known to those skilled in the art, can be applied to each image prior to pixel-by-pixel analysis described above, or two series of images in the echo-train (one collected in the positive gradients and another in the negative gradients) can be analyzed independently before combining in the resultant image. - If the factor described in Eqn. [13] is used in the fitting procedure to the signals in Eqn. [15], then an image, bearing information on the tissue-specific mesoscopic field inhomogeneities, R2'(x,y,z), can be produced according to the aforementioned Yablonskiy reference.
- It can be further appreciated by those skilled in the art that MR images resulting from Eqn. [14] that are acquired at the end of the echo-
train 104, correspond to long gradient echo times TE, are therefore T2* weighted. Hence, this new imaging technique produces T2, T1 or spin density, and/or T2* weighted images for each slice of the object/subject. Because all these images result from the analysis of the same data set, they are naturally co-registered. - Referring now to Fig. 3, another embodiment of the present invention is shown using a three-dimensional multi-gradient echo
imaging pulse sequence 110. After a subject/object is positioned in theMRI scanner 10, apulse sequence 110, designed according to Fig. 3 and described below, is produced by theMRI scanner 10 and applied by the RF receiving coils 56 andamplifiers computer memory 66 and processed according to the algorithms herein described to produce T2, T1 or spin density, and T2* images of the subject/object. In this embodiment, images are acquired as three-dimensional views of a thick slab from the subject/object. - Fig. 3 shows a
pulse sequence 110 designed to (1) encode information on the spatial distribution of the subject/object with T2, T1 or spin density, and T2* properties; and to (2) collect necessary magnetic resonance signals that may be reconstructed to produce T2, T1 or spin density, and/or T2* images of the subject/object. Thepulse sequence 110 includes six sections A-F, as in Fig. 2. As is evident, most of the 3-D pulse sequence 110 of Fig. 3 is similar to the 2-D pulse sequence 80 of Fig. 2 with similar function as described with reference to Fig. 2. For example, Section A includes anoptional RF pulse 112 which can be designed similarly to that described with reference to Fig. 2. TheRF pulse 112 is followed by dephasinggradients RF pulse 120 and a slice-selective gradient pulse 122, both of which have been described with reference to Fig. 2. - Section C of the 3-
D pulse sequence 110 of Fig. 3 includes threegradient pulses gradient pulse 124 is a 3-D phase encoding gradient pulse and is applied in the slab-selective direction Gs. Thegradient pulse 124 is applied in a direction perpendicular to the plane of the selected slab to encode spatial information on the subject/object into the magnetic resonance signal. Simultaneously, a phase encoding gradient pulse 126 is applied in the phase encoding direction Gp andgradient prepulse 128 is applied in the read-out direction Gr. Thegradient prepulse 128 is designed to preliminarily rephase transverse magnetization in order to define the position of thefirst gradient echo 130 of Section D which includes a series of fast switching gradient pulses 132 (i.e., the gradient pulse train). As previously described, if there are N gradient pulses in thetrain 132, there are N gradient echoes 134 from echo time TE1 to TEN. The read-outgradient pulses 132 and the gradient echoes 134 are followed by Section E which can include gradients or RF spoiling to destroy residual transverse magnetization. Also as previously described, Section F is simply a waiting period designed to restore longitudinal magnetization in a given slab. - In 3-D imaging, to collect information necessary to reconstruct images, the
entire pulse sequence 110 is repeated Np x Ns times, where Np is the image resolution in the phase-encoding direction and Ns is the image resolution in the slab-selection direction. Those skilled in the art appreciate that during each such repetition, the 3D and 2D phase-encoding gradients 124, 126 should be incremented by a certain calculated amount to achieve full coverage of the 3D image k-space. The results of this procedure is N 3D k-space data sets corresponding to N gradient echoes 134 where the Nth gradient echo is centered at the gradient echo time TEN. A three-dimensional Fourier transform of each of k-space data sets result in N complex 3D images: - After N images are obtained, the data is analyzed on a voxel-by-voxel basis to produce T2 and T1 or spin density weighted images. To do so, for each voxel (x,y,z) a data array is formed and assigned to the magnetic resonance signal as a function of time TE:
- Images acquired at the end of the echo-
train 134 that correspond to long gradient echo times TE are T2* weighted. Alternatively, if an additional function as in Eqn. [13] is used for data analysis, T2' images can also be produced. Accordingly, this imaging technique can produce T2, T1 or spin density, T2* or T2' weighted 3D images of the object/subject. Because all these images result from the analysis of the same data set, they are also naturally co-registered. - Referring now to Fig. 4, a flow chart of the
aforementioned algorithm 140 is shown. Afterinitialization 142 and positioning a patient in thescanner 144, thepulse sequences 146 is applied and MR data is acquired at 148. After reconstructing magnitude andphase images 150, the data arrays are constructed for eachpixel 152 and the system selects a model for the nonlinear function F(TE) 154. The data arrays are then fit to Eqn. [3] 156 and the system is able to reconstruct the images S(x, y, z; 0), T2, T2*, or T2' from the same data set. - The present invention was tested using the 2-D multi-slice multi-gradient echo imaging pulse sequence of Fig. 2 on a 1.5 Tesla whole body MRI scanner without any preparation pulses. Eleven images of a NiSO4 doped water phantom were acquired. The inter-echo time was 3.2 msec, TR was 40 msec with a matrix of 128x128. Acquisition time was complete in 6 seconds. R2 maps were obtained by fitting time domain data of signal intensity on a pixel by pixel basis to Eqn. [3] with Gaussian F(TE) from Eqn. [9]. The resultant R2 map was largely flat except for a pixel-size layer near the phantom surface. The average R2 was 12.7 sec-1 with a variation of 2% which was in agreement with the R2 value of (12.6±0.1) sec-1 obtained with a double-spin echo technique that has been a standard acquisition technique. To obtain such a map with the spin echo (SE) technique took approximately 84 seconds as compared to the 6 seconds of imaging time with the proposed method.
- Further testing took place by imaging the brain of a healthy volunteer. Nine images from each slice were collected utilizing only positive read-out gradient pulses so that the first image was acquired at TE1=2.742 msec followed by another eight gradient echo images separated by 3.83 msec. The Field-of-View was set at 30 cm with a matrix size was 256 x 256, a repetition time TR of 500 msec, and a flip angle of 80°. Ten 5-mm thick slices were acquired in an interleaved manner. One acquisition was used. Total acquisition time was 2 min. and 8 secs. Data was processed by using the model described in Eqn. [3] with the function F(TE) described in Eqn. [8]. The results were compared with images obtained with a standard Fast Spin Echo technique (RARE) from the same slices with the same geometrical parameters. Both techniques provided very similar images. However, in addition to the T2 images that were developed with the RARE technique, the present invention also produced T1 and T2* weighted images.
- Accordingly, the present invention provides a new technique for measuring T2 relaxation rate constant in MRS and MRI, and creating T2 image contrast in MRI. The technique is based on multi-gradient-echo approach and allows obtaining a T2 contrast in MRI without exploitation of any SE techniques. Furthermore, it has the additional advantages of obtaining of T2, T1 or spin density, and T2* weighted images in a single scan. All these images are also naturally co-registered. As described, both 3D and multi-slice 2D versions can be implemented. This approach requires substantially less RF power compared to SE approaches and allows for fast imaging with repetition time (TR) on the order of 25 msec on a typical clinical scanner.
- Although two embodiments of the invention have been described in detail, those skilled in the art will appreciate that additional modifications are possible. For example, 2D or 3D images corresponding to different gradient echo times TE can be collected by means of a spiral scanning technique instead the Fourier Transform Imaging technique discussed herein. Data may then be arranged according to Eqns. [15], and [17] and analyzed using the same algorithms as previously discussed to provide T2, T1 or spin density, T2*, or T2' weighted images.
- Another alternative includes the use of signal amplitude and phase. As previously described, the function F(TE) can be evaluated by fitting experimental data to the MR signal magnitude equation. However, information on the function F(TE) can also be obtained by making use of phase images in addition to the magnitude images. As is known, both signal magnitude and phase are readily available from the complex MR signal as described in Eqns. [14-17]. More specifically, the phase images allow calculation of average magnetic field for each voxel, B(x,y,z), by fitting phase in each voxel to the equation:
- Accordingly, the present invention includes a method of acquiring MR images that includes acquiring multiple sets of MR data from our series of readout gradient pulses in a pulse sequence and determining a nonlinear function of gradient echo time F(TE) to offset magnetic field inhomogeneities. The method also includes fitting the MR data to an equation that includes the nonlinear function F(TE) in Eq. [3] and creating at least S(x, y, z;0) and T2(x,y,z) images using the results of the fitting step. If additional nonlinear function Fmeso(TE) in Eq. [13] is used, the invention allows creating images that give information on tissue blood volume and blood oxygenation level.
- The invention also includes an MRI apparatus to rapidly acquire T2 weighted MR images using gradient echo imaging that includes a magnetic resonance imaging (MRI) system having a plurality of gradient coils positioned about a bore of a magnet to impress a polarizing magnetic field. The MRI system also includes an RF transceiver system and an RF switch controlled by a pulse module to transmit RF signals to an RF coil assembly to acquire the MR images. The apparatus includes a computer programmed to acquire multiple sets of MR data from a series of read-out gradient pulses in a pulse sequence and determine signal intensity for each MR data. The computer is also programmed to fit the MR data to a signal magnitude equation that includes a nonlinear function. T2 weighted MR images are then reconstructed that are substantially free of magnetic field inhomogeneities.
- The invention also includes a computer program for use with an MRI apparatus that includes instructions which, when executed by a computer, cause the computer to apply a pulse sequence with a train of gradient read-out pulses and acquire MR data during the train of gradient read-out pulses. Depending upon identification of an object scanned, the computer program also determines a nonlinear function of gradient echo time and fits signal magnitudes of the MR data to a signal magnitude equation. The program can then reconstruct MR images using results of the equation fit wherein the MR images reconstructed can include S (x,y,z;0) and T2(x,y,z) weighted images.
- The present invention has been described in terms of the preferred embodiment, and it is recognized that equivalents, alternatives, and modifications, aside from those expressly stated, are possible and within the scope of the appending claims.
Claims (19)
- A method (140) of acquiring MR images comprising the steps of:acquiring (148) multiple sets of MR data from a series of read-out gradient pulses in a pulse sequence (80, 110);determining a nonlinear function of gradient echo time F(TE) (154) to offset magnetic field inhomogeneities;fitting the MR data (156) to an equation that includes the nonlinear function F(TE); andcreating S(0) and T2 images (158) using the results of the fitting step (156).
- The method (140) of claim 1 further comprising the step of creating a T2* image (158) based on the same MR data used to create the S(0) and T2 images.
- The method (140) of claim 1 further comprising the step of creating a T2' image (158) based on the same MR data used to create the S(0) and T2 images.
- The method (140) of claim 1 further comprising the step of creating tissue blood volume and blood oxygenation level images (158) based on the same MR data used to create the S(x,y;0) and T2 images.
- The method (140) of claim 1 wherein the MR data is acquired (148) with one of a two-dimensional multi-gradient echo imaging pulse sequence (80) and a three-dimensional multi-gradient echo imaging pulse sequence (110).
- The method (140) of claim 1 wherein the step of determining a nonlinear function of gradient echo time F(TE) (154) includes accounting for macroscopic magnetic field inhomogeneities.
- The method (140) of claim 1 wherein the step of determining a nonlinear function of gradient echo time F(TE) (154) is generalized as:
- The method (140) of claim 7 further comprising approximating the generalized equation to one of:
- The method (140) of claim 7 further comprising approximating the generalized equation to:
- The method (140) of claim 7 further comprising approximating the generalized equation to:
- The method (140) of claim 1 wherein the equation that includes the nonlinear function is:
- The method (140) of claim 1 wherein the equation that includes the nonlinear function accounts for both macroscopic and mesoscopic field inhomogeneities and is given by:
- An MRI apparatus to rapidly acquire T2 weighted MR images using gradient echo imaging comprising:a magnetic resonance imaging (MRI) system (10) having a plurality of gradient coils (50) positioned about a bore of a magnet (52) to impress a polarizing magnetic field, an RF transceiver system (56), and an RF switch (62) controlled by a pulse module (38) to transmit and receive RF signals to and from an RF coil assembly (56) to acquire MR images; anda computer (20) programmed to:acquire multiple sets of MR data (148) from a series of read-out gradient pulses in a pulse sequence (80, 110);determine signal intensity for each MR data (148);fit the MR data (156) to a signal magnitude equation that includes a nonlinear function (154); andreconstruct T2 weighted MR images (158) that are substantially free of magnetic field inhomogeneities.
- The MRI apparatus of claim 13 and wherein the MR images reconstructed (158) include at least one of an S(0) image, a T2 image, and a T2* image and wherein the MR data (148) is acquired with one of a two-dimensional multi-gradient echo imaging pulse sequence (80) and a three-dimensional multi-gradient echo imaging pulse sequence (110).
- The MRI apparatus of claim 14 wherein the nonlinear function is of gradient echo time F(TE) and is generalized as:
- The MRI apparatus of claim 15 wherein the computer program approximates the generalized equation to one of:
- The MRI apparatus of claim 15 wherein the computer program approximates the generalized equation to:
- The MRI apparatus of claim 15 wherein the computer program approximates the generalized equation to:
- The MRI apparatus of claim 13 further comprising:a computer readable memory unit (26) having stored therein a number of models for the nonlinear function;a user input (13) to receive an input identifying an object scanned; andwherein the computer (20) is further programmed to determine a model for the nonlinear function based on the object scanned.
Applications Claiming Priority (4)
| Application Number | Priority Date | Filing Date | Title |
|---|---|---|---|
| US19099400P | 2000-03-21 | 2000-03-21 | |
| US190994P | 2000-03-21 | ||
| US09/704,285 US6603989B1 (en) | 2000-03-21 | 2000-11-01 | T2 contrast in magnetic resonance imaging with gradient echoes |
| US704285 | 2000-11-01 |
Publications (3)
| Publication Number | Publication Date |
|---|---|
| EP1136836A2 true EP1136836A2 (en) | 2001-09-26 |
| EP1136836A3 EP1136836A3 (en) | 2003-09-03 |
| EP1136836B1 EP1136836B1 (en) | 2012-02-29 |
Family
ID=26886633
Family Applications (1)
| Application Number | Title | Priority Date | Filing Date |
|---|---|---|---|
| EP01302617A Expired - Lifetime EP1136836B1 (en) | 2000-03-21 | 2001-03-21 | T2 contrast in magnetic resonance imaging with gradient echoes |
Country Status (3)
| Country | Link |
|---|---|
| US (1) | US6603989B1 (en) |
| EP (1) | EP1136836B1 (en) |
| JP (2) | JP2001346774A (en) |
Cited By (14)
| Publication number | Priority date | Publication date | Assignee | Title |
|---|---|---|---|---|
| WO2003086191A1 (en) * | 2002-04-08 | 2003-10-23 | Robarts Research Institute | System and method for generating t1 and t2 maps |
| WO2006018780A1 (en) | 2004-08-13 | 2006-02-23 | Philips Intellectual Property & Standards Gmbh | Mr method for the quantitative determination of local relaxation time values |
| DE102005027483B3 (en) * | 2005-06-14 | 2006-12-07 | Technische Universität München | Magnetic resonance measurement data recovery method for generating object image used in e.g. computer tomography, involves exposing object volume to be imaged to sequence of repeating blocks of effects having radio frequency pulse |
| DE102005060986B3 (en) * | 2005-12-20 | 2007-08-23 | Siemens Ag | Method for determining transverse relaxation time T2 * in MR data |
| WO2008082341A1 (en) * | 2007-01-02 | 2008-07-10 | Synthetic Mr Ab | A method of visualizing mr images |
| EP2221627A1 (en) * | 2009-02-20 | 2010-08-25 | IBBT vzw | Method and assembly for correcting a relaxation map for medical imaging applications |
| US7800367B2 (en) * | 2008-04-02 | 2010-09-21 | General Electric Co. | Method and apparatus for generating T2* weighted magnetic resonance images |
| WO2011114264A1 (en) * | 2010-03-18 | 2011-09-22 | Koninklijke Philips Electronics N.V. | Simultaneous and dynamic determination of longitudinal and transversal relaxation times of a nuclear spin system |
| WO2012145197A1 (en) * | 2011-04-19 | 2012-10-26 | Wisconsin Alumni Research Foundation | Method for r * 2 quantification with mri using correction for macroscopic magnetic field inhomogeneities |
| CN104808161A (en) * | 2014-01-27 | 2015-07-29 | 西门子(深圳)磁共振有限公司 | Magnetic resonance imaging method and apparatus |
| US9507000B2 (en) | 2008-10-13 | 2016-11-29 | Koninklijke Philips N.V. | Flow insensitive magnetization preparation pulse for T2* contrast |
| WO2017031638A1 (en) * | 2015-08-21 | 2017-03-02 | Shanghai United Imaging Healthcare Co., Ltd. | System and method for flip angle determination in magnetic resonance imaging |
| WO2020034674A1 (en) * | 2018-08-14 | 2020-02-20 | 清华大学 | Quantitative myocardial magnetic resonance imaging method and device, and storage medium |
| WO2020034675A1 (en) * | 2018-08-14 | 2020-02-20 | 清华大学 | Magnetic resonance imaging method for myocardial quantification, and device and storage medium therefor |
Families Citing this family (26)
| Publication number | Priority date | Publication date | Assignee | Title |
|---|---|---|---|---|
| US6914428B2 (en) * | 2002-08-15 | 2005-07-05 | General Electric Company | Magnetic resonance imaging systems and methods for acquiring multi-slice gradient echo images |
| JP4613065B2 (en) * | 2002-08-27 | 2011-01-12 | ケネディー クリーガー インスティチュート | Magnetic resonance imaging of blood volume in microvessels |
| DE10354941B4 (en) * | 2002-12-02 | 2010-05-12 | Siemens Ag | Determination of B1 field strength in MR measurements |
| US7081751B2 (en) * | 2002-12-31 | 2006-07-25 | The Uab Research Foundation | Systems and methods for estimating properties of a sample |
| DE10338074B4 (en) * | 2003-08-19 | 2008-05-15 | Siemens Ag | Method for compensation of contrast inhomogeneities in magnetic resonance images and magnetic resonance measuring system and computer program product |
| JP4519446B2 (en) * | 2003-11-10 | 2010-08-04 | ジーイー・メディカル・システムズ・グローバル・テクノロジー・カンパニー・エルエルシー | Nuclear magnetic resonance imaging system |
| DE102004019394B4 (en) * | 2004-04-19 | 2008-04-03 | Forschungszentrum Jülich GmbH | Imaging method and magnetic resonance tomograph for recording the longitudinal spin-lattice relaxation time |
| EP1751583A2 (en) * | 2004-05-14 | 2007-02-14 | The General Hospital Corporation | Methods for obtaining mri frequency maps |
| US7276904B2 (en) * | 2005-05-24 | 2007-10-02 | General Electric Company | Method for generating T1-weighted magnetic resonance images and quantitative T1 maps |
| DE102006033248B4 (en) | 2006-07-18 | 2009-10-22 | Siemens Ag | Method for transforming a distortion-corrected magnetic resonance image, method for carrying out magnetic resonance measurements and image transformation unit |
| DE102008022325A1 (en) | 2008-04-30 | 2009-11-05 | Eberhard-Karls-Universität Tübingen | Method for measuring the level of cerebrospinal fluid in the brain tissue of a living being |
| WO2010051267A1 (en) * | 2008-10-27 | 2010-05-06 | Mayo Foundation For Medical Education And Resaerch | System and method for identifying the potential for and the presence of neurodegenerative diseases using magnetic resonance imaging |
| WO2010048708A1 (en) * | 2008-10-27 | 2010-05-06 | The University Of Western Ontario | System and method for magnetic resonance imaging |
| WO2010114608A1 (en) | 2009-04-02 | 2010-10-07 | Regents Of The University Of Minnesota | Mp-swift with adiabatic inversion preparation |
| JP5562095B2 (en) * | 2010-03-31 | 2014-07-30 | ジーイー・メディカル・システムズ・グローバル・テクノロジー・カンパニー・エルエルシー | Magnetic resonance imaging system |
| DE102010041450B4 (en) * | 2010-09-27 | 2012-11-08 | Siemens Aktiengesellschaft | Automatic creation of a selectively tissue-type MR image |
| US8903151B2 (en) * | 2010-12-22 | 2014-12-02 | Mayo Foundation For Medical Education And Research | System and method for assessing operation of an imaging system |
| US8886283B1 (en) | 2011-06-21 | 2014-11-11 | Stc.Unm | 3D and 4D magnetic susceptibility tomography based on complex MR images |
| KR101310706B1 (en) * | 2012-04-05 | 2013-09-24 | 고려대학교 산학협력단 | Magnet resonance imaging device for constructing grey matter mr image selectively and method using the same |
| US9618596B2 (en) * | 2012-07-02 | 2017-04-11 | Syntheticmr Ab | Methods and systems for improved magnetic resonance acquisition using a single acquisition type |
| DE102013215703B3 (en) * | 2013-08-08 | 2015-02-05 | Siemens Aktiengesellschaft | Determination of a T1 time of water and a T1 time of fat |
| CN105232046B (en) * | 2015-11-26 | 2017-12-29 | 厦门大学 | A kind of single sweep Quantitative MRI Measurement T2 imaging methods based on overlapping echo |
| CN105232045B (en) * | 2015-11-26 | 2017-12-29 | 厦门大学 | Single sweep Quantitative MRI Measurement diffusion imaging method based on double echo |
| US10718841B2 (en) * | 2016-01-14 | 2020-07-21 | Beth Israel Deaconess Medical Center, Inc. | System and method for improved homogeneous and inhomogeneous magnetization transfer magnetic resonance imaging |
| US10451697B2 (en) | 2017-07-25 | 2019-10-22 | Spintech, Inc. | Systems and methods for strategically acquired gradient echo imaging |
| CN108010100B (en) * | 2017-12-07 | 2020-02-18 | 厦门大学 | Single-scanning magnetic resonance quantitative T based on residual error network2Imaging reconstruction method |
Family Cites Families (16)
| Publication number | Priority date | Publication date | Assignee | Title |
|---|---|---|---|---|
| US5168226A (en) * | 1991-05-22 | 1992-12-01 | General Electric | Acquisition of multiple images in fast spin echo nmr scans |
| US5245282A (en) | 1991-06-28 | 1993-09-14 | University Of Virginia Alumni Patents Foundation | Three-dimensional magnetic resonance imaging |
| JPH06105820A (en) * | 1992-09-25 | 1994-04-19 | Toshiba Corp | Data collection system for mri apparatus |
| US5732701A (en) * | 1992-12-15 | 1998-03-31 | Ge Yokogawa Medical Systems, Limited | Data collection method for MR angiography |
| JP3419840B2 (en) * | 1993-08-30 | 2003-06-23 | 株式会社東芝 | Magnetic resonance imaging equipment |
| JP3431249B2 (en) * | 1993-12-27 | 2003-07-28 | 株式会社東芝 | Magnetic resonance imaging |
| JP3392478B2 (en) * | 1993-09-14 | 2003-03-31 | 株式会社東芝 | Magnetic resonance imaging |
| US5438992A (en) * | 1993-11-01 | 1995-08-08 | Georgia Tech Research Corporation | Flow-induced artifact elimination in magnetic resonance images |
| JP3512482B2 (en) * | 1994-09-06 | 2004-03-29 | 株式会社東芝 | Magnetic resonance imaging |
| JP3384944B2 (en) * | 1996-07-11 | 2003-03-10 | ジーイー横河メディカルシステム株式会社 | MRI equipment |
| IT1289809B1 (en) * | 1996-12-27 | 1998-10-16 | Ist Trentino Di Cultura | PROCESS AND AUTOMATIC SYSTEM TO OBTAIN WATER CONTENT AND / OR ELECTRIC PERMITIVITY MAPS FROM RESONANCE IMAGES |
| US5917323A (en) * | 1997-07-01 | 1999-06-29 | General Electric Company | Correction of axial image signal fall off caused by Maxwell terms |
| JP3415754B2 (en) * | 1997-11-12 | 2003-06-09 | ジーイー横河メディカルシステム株式会社 | MRI equipment |
| US6188219B1 (en) * | 1999-01-22 | 2001-02-13 | The Johns Hopkins University | Magnetic resonance imaging method and apparatus and method of calibrating the same |
| US6285187B1 (en) * | 1999-04-28 | 2001-09-04 | General Electric Company | Method and apparatus for reducing artifacts in echo planar imaging |
| JP3365983B2 (en) * | 1999-09-28 | 2003-01-14 | ジーイー横河メディカルシステム株式会社 | MRI equipment |
-
2000
- 2000-11-01 US US09/704,285 patent/US6603989B1/en not_active Expired - Lifetime
-
2001
- 2001-03-21 JP JP2001080920A patent/JP2001346774A/en active Pending
- 2001-03-21 EP EP01302617A patent/EP1136836B1/en not_active Expired - Lifetime
-
2009
- 2009-10-23 JP JP2009244649A patent/JP4901937B2/en not_active Expired - Fee Related
Non-Patent Citations (1)
| Title |
|---|
| YABLONSKIY D A: "Quantitation of intrinsic magnetic susceptibility-related effects in a tissue matrix. Phantom study" MAGNETIC RESONANCE IN MEDICINE, MARCH 1998, WILLIAMS & WILKINS, USA, vol. 39, no. 3, pages 417-428, XP002246092 ISSN: 0740-3194 * |
Cited By (26)
| Publication number | Priority date | Publication date | Assignee | Title |
|---|---|---|---|---|
| WO2003086191A1 (en) * | 2002-04-08 | 2003-10-23 | Robarts Research Institute | System and method for generating t1 and t2 maps |
| WO2006018780A1 (en) | 2004-08-13 | 2006-02-23 | Philips Intellectual Property & Standards Gmbh | Mr method for the quantitative determination of local relaxation time values |
| DE102005027483B3 (en) * | 2005-06-14 | 2006-12-07 | Technische Universität München | Magnetic resonance measurement data recovery method for generating object image used in e.g. computer tomography, involves exposing object volume to be imaged to sequence of repeating blocks of effects having radio frequency pulse |
| CN101063712B (en) * | 2005-12-20 | 2012-06-20 | 西门子公司 | Method for determination of the transverse relaxation time T2* in MR data |
| DE102005060986B3 (en) * | 2005-12-20 | 2007-08-23 | Siemens Ag | Method for determining transverse relaxation time T2 * in MR data |
| US7501821B2 (en) | 2005-12-20 | 2009-03-10 | Siemens Aktiengesellschaft | Method for determination of the transverse relaxation time T2* in MR data |
| WO2008082341A1 (en) * | 2007-01-02 | 2008-07-10 | Synthetic Mr Ab | A method of visualizing mr images |
| US8874189B2 (en) | 2007-01-02 | 2014-10-28 | Syntheticmr Ab | Method of visualizing MR images |
| US7800367B2 (en) * | 2008-04-02 | 2010-09-21 | General Electric Co. | Method and apparatus for generating T2* weighted magnetic resonance images |
| US9507000B2 (en) | 2008-10-13 | 2016-11-29 | Koninklijke Philips N.V. | Flow insensitive magnetization preparation pulse for T2* contrast |
| US8655038B2 (en) | 2009-02-20 | 2014-02-18 | Iminds Vzw | Method and assembly for correcting a relaxation map for medical imaging applications |
| WO2010094655A1 (en) * | 2009-02-20 | 2010-08-26 | Ibbt Vzw | Method and assembly for correcting a relaxation map for medical imaging applications |
| EP2221627A1 (en) * | 2009-02-20 | 2010-08-25 | IBBT vzw | Method and assembly for correcting a relaxation map for medical imaging applications |
| CN102859386A (en) * | 2010-03-18 | 2013-01-02 | 皇家飞利浦电子股份有限公司 | Simultaneous and dynamic determination of longitudinal and transversal relaxation times of a nuclear spin system |
| CN102859386B (en) * | 2010-03-18 | 2015-08-19 | 皇家飞利浦电子股份有限公司 | While the vertical and horizontal relaxation time of nuclear spin system and dynamically determine |
| WO2011114264A1 (en) * | 2010-03-18 | 2011-09-22 | Koninklijke Philips Electronics N.V. | Simultaneous and dynamic determination of longitudinal and transversal relaxation times of a nuclear spin system |
| US9588205B2 (en) | 2010-03-18 | 2017-03-07 | Koninklijke Philips N.V. | Simultaneous and dynamic determination of longitudinal and transversal relaxation times of a nuclear spin system |
| WO2012145197A1 (en) * | 2011-04-19 | 2012-10-26 | Wisconsin Alumni Research Foundation | Method for r * 2 quantification with mri using correction for macroscopic magnetic field inhomogeneities |
| CN104808161A (en) * | 2014-01-27 | 2015-07-29 | 西门子(深圳)磁共振有限公司 | Magnetic resonance imaging method and apparatus |
| WO2017031638A1 (en) * | 2015-08-21 | 2017-03-02 | Shanghai United Imaging Healthcare Co., Ltd. | System and method for flip angle determination in magnetic resonance imaging |
| GB2545149A (en) * | 2015-08-21 | 2017-06-07 | Shenzhen United Imaging Healthcare Co Ltd | System and method for flip angle determination in magnetic resonance imaging |
| GB2545149B (en) * | 2015-08-21 | 2017-10-25 | Shenzhen United Imaging Healthcare Co Ltd | System and method for flip angle determination in magnetic resonance imaging |
| CN108024757A (en) * | 2015-08-21 | 2018-05-11 | 深圳联影医疗科技有限公司 | The system and method that deflection angle is determined in Magnetic resonance imaging |
| CN108024757B (en) * | 2015-08-21 | 2020-10-30 | 上海联影医疗科技有限公司 | System and method for determining deflection angle in magnetic resonance imaging |
| WO2020034674A1 (en) * | 2018-08-14 | 2020-02-20 | 清华大学 | Quantitative myocardial magnetic resonance imaging method and device, and storage medium |
| WO2020034675A1 (en) * | 2018-08-14 | 2020-02-20 | 清华大学 | Magnetic resonance imaging method for myocardial quantification, and device and storage medium therefor |
Also Published As
| Publication number | Publication date |
|---|---|
| JP2010046510A (en) | 2010-03-04 |
| EP1136836B1 (en) | 2012-02-29 |
| EP1136836A3 (en) | 2003-09-03 |
| JP2001346774A (en) | 2001-12-18 |
| US6603989B1 (en) | 2003-08-05 |
| JP4901937B2 (en) | 2012-03-21 |
Similar Documents
| Publication | Publication Date | Title |
|---|---|---|
| US6603989B1 (en) | T2 contrast in magnetic resonance imaging with gradient echoes | |
| US9513358B2 (en) | Method and apparatus for magnetic resonance imaging | |
| US6147492A (en) | Quantitative MR imaging of water and fat using a quadruple-echo sequence | |
| US6078176A (en) | Fast spin echo pulse sequence for diffusion weighted imaging | |
| US7602179B2 (en) | System and method for multi-echo bandwidth match imaging | |
| JP5735793B2 (en) | System for quantitatively separating seed signals in MR imaging | |
| US6559642B2 (en) | Calibration method for use with sensitivity encoding MRI acquisition | |
| US7772844B2 (en) | System and method for tissue specific MR imaging of metabolites using spectral-spatially formed stimulated echo | |
| US20090093704A1 (en) | System, program product, and method of acquiring and processing mri data for simultaneous determination of water, fat, and transverse relaxation time constants | |
| EP2839308A1 (en) | Mr imaging using apt contrast enhancement and sampling at multiple echo times | |
| US9211082B2 (en) | Method for magnetic resonance imaging using saturation harmonic induced rotary saturation | |
| RU2683605C1 (en) | Parallel mri with sensitivity mapping using rf coil | |
| US8704518B2 (en) | System and method of high signal-to-noise ratio magnetic resonance imaging screening | |
| US7197353B2 (en) | Sensitivity encoding MRI acquisition method | |
| US6469505B1 (en) | Method and apparatus to reduce perturbation field effects in MR images by restricting the region of interest | |
| Jaffer et al. | A method to improve the BO homogeneity of the heart in vivo | |
| EP3754357A1 (en) | Magnetic resonance electric properties tomography without contrast agent | |
| US8928317B2 (en) | System and method for controlling apparent timing dependencies for T2-weighted MRI imaging | |
| EP3966583B1 (en) | Dual echo steady state mr imaging using bipolar diffusion gradients | |
| US20220057467A1 (en) | Epi mr imaging with distortion correction | |
| WO2003086191A1 (en) | System and method for generating t1 and t2 maps | |
| US10823803B2 (en) | Method and apparatus for reconstructing contrast levels from magnetic resonance acquisitions | |
| US20230236274A1 (en) | System and Methods for Ultra-Fast Multi-Dimensional Diffusion-Relaxation MRI Using Time-Division Multiplexing Sequences | |
| US20230333186A1 (en) | Method and system for t1 mapping for tissue characterized by short-t2 relaxation in mri | |
| US20020022778A1 (en) | Imaging technique and magnetic resonance tomograph |
Legal Events
| Date | Code | Title | Description |
|---|---|---|---|
| PUAI | Public reference made under article 153(3) epc to a published international application that has entered the european phase |
Free format text: ORIGINAL CODE: 0009012 |
|
| AK | Designated contracting states |
Kind code of ref document: A2 Designated state(s): AT BE CH CY DE DK ES FI FR GB GR IE IT LI LU MC NL PT SE TR |
|
| AX | Request for extension of the european patent |
Free format text: AL;LT;LV;MK;RO;SI |
|
| PUAL | Search report despatched |
Free format text: ORIGINAL CODE: 0009013 |
|
| AK | Designated contracting states |
Kind code of ref document: A3 Designated state(s): AT BE CH CY DE DK ES FI FR GB GR IE IT LI LU MC NL PT SE TR |
|
| AX | Request for extension of the european patent |
Extension state: AL LT LV MK RO SI |
|
| 17P | Request for examination filed |
Effective date: 20031229 |
|
| AKX | Designation fees paid |
Designated state(s): DE NL |
|
| 17Q | First examination report despatched |
Effective date: 20071005 |
|
| GRAP | Despatch of communication of intention to grant a patent |
Free format text: ORIGINAL CODE: EPIDOSNIGR1 |
|
| GRAS | Grant fee paid |
Free format text: ORIGINAL CODE: EPIDOSNIGR3 |
|
| GRAA | (expected) grant |
Free format text: ORIGINAL CODE: 0009210 |
|
| AK | Designated contracting states |
Kind code of ref document: B1 Designated state(s): DE NL |
|
| REG | Reference to a national code |
Ref country code: DE Ref legal event code: R096 Ref document number: 60146178 Country of ref document: DE Effective date: 20120419 |
|
| REG | Reference to a national code |
Ref country code: NL Ref legal event code: T3 |
|
| PGFP | Annual fee paid to national office [announced via postgrant information from national office to epo] |
Ref country code: NL Payment date: 20120327 Year of fee payment: 12 |
|
| PLBE | No opposition filed within time limit |
Free format text: ORIGINAL CODE: 0009261 |
|
| STAA | Information on the status of an ep patent application or granted ep patent |
Free format text: STATUS: NO OPPOSITION FILED WITHIN TIME LIMIT |
|
| 26N | No opposition filed |
Effective date: 20121130 |
|
| REG | Reference to a national code |
Ref country code: DE Ref legal event code: R097 Ref document number: 60146178 Country of ref document: DE Effective date: 20121130 |
|
| REG | Reference to a national code |
Ref country code: NL Ref legal event code: V1 Effective date: 20131001 |
|
| PGFP | Annual fee paid to national office [announced via postgrant information from national office to epo] |
Ref country code: DE Payment date: 20130926 Year of fee payment: 13 |
|
| PG25 | Lapsed in a contracting state [announced via postgrant information from national office to epo] |
Ref country code: NL Free format text: LAPSE BECAUSE OF NON-PAYMENT OF DUE FEES Effective date: 20131001 |
|
| REG | Reference to a national code |
Ref country code: DE Ref legal event code: R119 Ref document number: 60146178 Country of ref document: DE |
|
| REG | Reference to a national code |
Ref country code: DE Ref legal event code: R119 Ref document number: 60146178 Country of ref document: DE Effective date: 20141001 |
|
| PG25 | Lapsed in a contracting state [announced via postgrant information from national office to epo] |
Ref country code: DE Free format text: LAPSE BECAUSE OF NON-PAYMENT OF DUE FEES Effective date: 20141001 |