EP0105700A2 - Nuclear magnetic resonance methods - Google Patents
Nuclear magnetic resonance methods Download PDFInfo
- Publication number
- EP0105700A2 EP0105700A2 EP83305804A EP83305804A EP0105700A2 EP 0105700 A2 EP0105700 A2 EP 0105700A2 EP 83305804 A EP83305804 A EP 83305804A EP 83305804 A EP83305804 A EP 83305804A EP 0105700 A2 EP0105700 A2 EP 0105700A2
- Authority
- EP
- European Patent Office
- Prior art keywords
- gradients
- slice
- pulse
- spin
- reversal
- Prior art date
- Legal status (The legal status is an assumption and is not a legal conclusion. Google has not performed a legal analysis and makes no representation as to the accuracy of the status listed.)
- Granted
Links
Images


Classifications
-
- G—PHYSICS
- G01—MEASURING; TESTING
- G01R—MEASURING ELECTRIC VARIABLES; MEASURING MAGNETIC VARIABLES
- G01R33/00—Arrangements or instruments for measuring magnetic variables
- G01R33/20—Arrangements or instruments for measuring magnetic variables involving magnetic resonance
- G01R33/44—Arrangements or instruments for measuring magnetic variables involving magnetic resonance using nuclear magnetic resonance [NMR]
- G01R33/48—NMR imaging systems
- G01R33/483—NMR imaging systems with selection of signals or spectra from particular regions of the volume, e.g. in vivo spectroscopy
- G01R33/485—NMR imaging systems with selection of signals or spectra from particular regions of the volume, e.g. in vivo spectroscopy based on chemical shift information [CSI] or spectroscopic imaging, e.g. to acquire the spatial distributions of metabolites
-
- G—PHYSICS
- G01—MEASURING; TESTING
- G01R—MEASURING ELECTRIC VARIABLES; MEASURING MAGNETIC VARIABLES
- G01R33/00—Arrangements or instruments for measuring magnetic variables
- G01R33/20—Arrangements or instruments for measuring magnetic variables involving magnetic resonance
- G01R33/44—Arrangements or instruments for measuring magnetic variables involving magnetic resonance using nuclear magnetic resonance [NMR]
- G01R33/48—NMR imaging systems
- G01R33/54—Signal processing systems, e.g. using pulse sequences ; Generation or control of pulse sequences; Operator console
- G01R33/56—Image enhancement or correction, e.g. subtraction or averaging techniques, e.g. improvement of signal-to-noise ratio and resolution
- G01R33/561—Image enhancement or correction, e.g. subtraction or averaging techniques, e.g. improvement of signal-to-noise ratio and resolution by reduction of the scanning time, i.e. fast acquiring systems, e.g. using echo-planar pulse sequences
- G01R33/5615—Echo train techniques involving acquiring plural, differently encoded, echo signals after one RF excitation, e.g. using gradient refocusing in echo planar imaging [EPI], RF refocusing in rapid acquisition with relaxation enhancement [RARE] or using both RF and gradient refocusing in gradient and spin echo imaging [GRASE]
- G01R33/5616—Echo train techniques involving acquiring plural, differently encoded, echo signals after one RF excitation, e.g. using gradient refocusing in echo planar imaging [EPI], RF refocusing in rapid acquisition with relaxation enhancement [RARE] or using both RF and gradient refocusing in gradient and spin echo imaging [GRASE] using gradient refocusing, e.g. EPI
Definitions
- This invention relates to methods of investigating a body by nuclear magnetic resonance (NMR).
- a further NMR parameter in which interest has grown rapidly over recent years is chemical shift.
- it is, in principle, possible to obtain sufficient information to construct a two dimensional chemical shift map, with corresponding image of the object.
- this process may be somewhat lengthy and tedious.
- EP echo planar
- a method of investigating a body by NMR comprises: preferentially exciting resonance in a slice of the body; applying a magnetic field to said body having first and second gradients in different directions in said slice, both said gradients being periodically reversed at regular intervals; detecting the free induction decay signals occurring when said gradients are applied; and processing the detected signals to retrieve data.
- the invention further provides a method of investigating a body by NMR comprising performing the method according to the invention twice with at least one of the gradients starting in the second performance with opposite polarity with respect to the first performance.
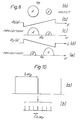
- FIG. 1 consider an extended body 1 placed in a polarizing magnetic field B 0 and a magnetic field gradient G z .
- a tailored selective RF pulse B 1 (t) applied along the x-axis in the rotating reference frame so as to excite preferentially those spins which lie in a slice 3 of the body (shaded) of thickness ⁇ z at displacement z.
- the corresponding range of Larmor frequencies excited is given approximately by whereAis the magneto-gyric ratio of the particular spin species considered. It is approximate in the sense that such tailored pulses automatically introduce some dispersive element of magnetization.
- the unwanted x-component of signal may be minimized by subtle changes in the RF pulse shape. Since selection does not unduly perturb adjacent layers of material, rapid scanning of several layers may be achieved without the necessity of waiting T 1 , the spin lattice relaxation time, between different plane scans.
- One dimensional mapping of the data contained in the signal of Figure 2c may be achieved by a conventional EP imaging procedure as illustrated in Figure 3.
- FIGS 3a and 3b show the slice selection procedure described above with reference to Figure 2 together with an additional y-gradient (G ) modulation (Figure 3c), commenced at the focussed signal peak, the x-directional gradient (G ) being zero and therefore not shown.
- G y is trapezoidally modulated (ideally rectangular) and in a perfectly homogeneous static magnetic field B 0 produces an initial FID followed by a sequence of modified spin echoes 2n ⁇ y ⁇ T 2 where T 2 is the spin-spin relaxation time. This part of the procedure is identical to a standard alignment procedure in EP imaging.
- the selected slice of material, Figure 4a is a homogeneous disc.
- the spin projection of this disc in a static gradient G y gives a semi-elliptic absorption line shape g( ⁇ )(dotted Figure 4b). This is obtained by sampling just the initial FID.
- the effect of sampling the complete spin echo sequence of Figure 3d and Fourier transforming is to convert the continuous projection profile (dotted) into the discrete stick spectrum, Figure 4b.
- the stick spacing ⁇ y is related to the spin echo period 2 ⁇ and the number of data sample points P with sampling time ⁇ o by the following relationships where ⁇ p is the angular frequency per point in the Fourier transform (FT) and
- the process of converting the continuous projection profile into a stick spectrum effectively squeezes signals obtained from the continuous spectrum in the range ⁇ y (that is to say, the area under the profile) into a single frequency stick, with equal area and centred within the frequency element.
- the tubes are separated along the y-axis and therefore the chemical shift map and its projection spectrum can be unambiguously assigned. That is to say, the signal from tube A can be unambiguously assigned to the absorption peak ⁇ A , Figure 5c,via the y-5 plot of Figure 5b.
- the encoding is achieved entirely by G y and by appropriately placing the tubes with y displacements so that no overlap occurs.
- Figure 9a shows the specimen projection spectra in both +G y (solid) and -G y (dotted).
- the separated y- ⁇ maps are shown in Figure 9c and are assignable.
- the map obtained without performing the double shot experiment and subsequent editing and splicing procedure discussed above leads to a y- ⁇ map which overlaps along the y-axis (see Figure 9d) through two causes.
- the first is an aliasing like effect when one or more of the specimens fills more than half the object field along the y direction.
- the G y phase alternated sequence described above is really a two shot experiment with T n between shots. This is a perfectly satisfactory method of chemical shift mapping when time is not of primary concern. However, if a complete one shot experiment is necessary, it is straightforward to combine the two phases of the experiment into a single experiment in which T D is effectively zero between phase alternated pairs. In this case the first and second selective RF pulses must have nutation or flip angles of 45° and 90 0 respectively. Other combinations of lower flip angle are also possible.
- Encoding along the x-axis is achieved by applying an additional G gradient as well as the. G gradient already described.
- the process is similar to EP imaging and for proper interpretation of the shift spectra corresponding spin density images are required. However, as explained later, full spin information including the spin density images are automatically available by the method described.
- Initial excitation of the spin system may be by using a non-selective pulse to excite all spins within the transmitter coil volume.
- a non-selective pulse to excite all spins within the transmitter coil volume.
- p(x,y,z) is the spin density
- ⁇ the magneto-gyric ratio, here considered the same for all spins
- G x (t'), G y (t') and G z (t') are linear time dependent field gradients.
- the time dependence for chemical shift mapping is preferably trapezoidal, although other time dependencies can be accommodated with appropriate non-linear transformation or non-linear sampling and FT with appropriate correction for the non-linearities introduced by sampling.
- Equation (6) can be reduced to where we assume that the initial excitation RF pulse is selective to a plane z.
- the spin density over a selected slice does not change significantly over the slice thickness and may therefore be replaced by an average spin density over z given by where ⁇ Z (x,y) is the average over the slice thickness ⁇ z. This will be true for thin slices.
- ⁇ Z (x,y) is the average over the slice thickness ⁇ z.
- TMR static magnetic field shaping
- a zoom facility could be constructed to look in finer detail at a single organ like the heart or a kidney without the need to examine the whole body cross- section. This facility would be of value in straightforward NMR imaging as well as in mapping of other NMR parameters, such as ⁇ , flow, T 1 , T 2 , etc.
- Equation (9) may be written as where If G y (t') is periodic modulo 4 ⁇ y then Equation (11) may be written as two expressions f,(x,t) and f 2 (x,t) depending on the starting phase of G (0).
- Equation (12a) Fourier transformation of Equation (12a) gives for large N where ⁇ ( ⁇ y - mA ⁇ y ) is the Dirac delta function and denotes convolution with the Fourier transform of the editing function E( ⁇ y ), etc.
- Equation (13) The element ⁇ y is the spatial displacement of the sticks in the spectrum of Equation (13).
- Equations (12a and b) can give a related time function which represents evolution of the spin system in either a wholly positive gradient +Gy (t) or a wholly negative gradient -G y (t).
- the two re3ated functions are and
- Equation (16) describes an FID type signal when G y is time independent.
- Equation (20) describes an FID type signal when G y is time independent.
- G x (t') is periodic modulo 4 ⁇ x '
- h 1 (m ⁇ y,t) and h 2 (m ⁇ y,t) which describe periodic spin echo sequences in which the initial phase of G x (t) is positive and negative respectively.
- h 1 and h 2 may be spliced to give h + (m ⁇ y, t) and h - (m ⁇ y,t) where where k - describes signal evolution in +ve or -ve x-gradients only.
- Equation (22) The function h - gives on Fourier transformation H - . which is similar to Equation (22).
- Equation (22) gives h + which when substituted for h(mAy,t) in Equation (19b) gives the fully spliced or edited function where the pixel volume ⁇ v is
- Equation (24) is one of four spliced functions, i.e. S ++ , S +- , S -+ , and S -- , which may be produced.
- Each function contains all the spatial information or spin density and by a suitable data reordering process in the frequency domain, these functions may be coadded to improve signal/noise.
- S ++ spliced functions
- T S is the time the experiment lasts and corresponds to the echo train length and total sampling time of the echo sequence.
- Equation (31d) applies for a real point FT (2N ⁇ N).
- ⁇ (x,y) is a continuous function of the position coordinates, it is convenient to break down the integral to a discrete sum of common chemical shifts, localized at specific parts of the object.
- the total chemically shifted distribution may be represented as weighted sum of shift components, i.e.
- a ,m component introduces a common frequency shift ⁇ j for all regions containing that shift.
- the actual positions of the shifted regions are mapped by the gradients together with the density function (Z).
- Equation (34) we also see from Equation (34) that for full unambiguous assignment of (no overlap or wraparound) we require and where L and N are as defined previously.
- Figures 11d and 11c respectively show the modulation diagrams for G x and G y which may be used in practice. Experimental difficulty will arise due to G switching at an echo peak, but since the signal is likely to be quite small here anyway, editing these echoes may not be too troublesome.
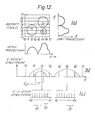
- Figure 12a shows the two dimensional object field of Figure 12a. This contains three discs of homogeneously distributed material and having two chemical shifts ⁇ 1 and ⁇ 2 as shown.
- the stick spectrum profiles are semi-elliptical in all cases, since the objects are homogeneous discs. If now the G modulation is added, we obtain a splitting of each y stick into a multiplet as shown for two cases y 2 and y 5 in Figure 12c.
- Figure 12c The spectrum of Figure 12c is in a form which is readily interpretable by stacking the 16 point data sets in the form of a third angle projection. This is illustrated in Figure 13afor the object of Figure 12a.
- Figure 13a For example projection along the ⁇ axis gives the spin density map Figure 13b.
- Projection along the x-axis gives the y - ⁇ density plot, Figure 13c, which is the result obtained in Section 2 without G x .
- projection along the y-axis gives the x - ⁇ density plot, Figure 13a.
Abstract
Description
- This invention relates to methods of investigating a body by nuclear magnetic resonance (NMR).
- Over the last several years considerable interest has been generated in the subject of NMR imaging. The major effort in this field has been devoted to spin density and relaxation time imaging in two and three dimensions in biomedical, plant and other systems.
- A further NMR parameter in which interest has grown rapidly over recent years is chemical shift. In variants of the projection reconstruction NMR imaging technique, it is, in principle, possible to obtain sufficient information to construct a two dimensional chemical shift map, with corresponding image of the object. However, this process may be somewhat lengthy and tedious.
- It is an object of the present invention to provide an echo planar (EP) NMR method or variant EP method suitable for obtaining spatial chemical shift information.
- According to the present invention a method of investigating a body by NMR comprises: preferentially exciting resonance in a slice of the body; applying a magnetic field to said body having first and second gradients in different directions in said slice, both said gradients being periodically reversed at regular intervals; detecting the free induction decay signals occurring when said gradients are applied; and processing the detected signals to retrieve data.
- In a preferred method in accordance with the invention during the detection of the free induction decay signals the phase of the reversal of one of said gradients with respect to the reversal of the other gradients is reversed.
- The invention further provides a method of investigating a body by NMR comprising performing the method according to the invention twice with at least one of the gradients starting in the second performance with opposite polarity with respect to the first performance.
- The invention will now be further explained and one method in accordance with the invention described by way of example, with reference to the accompanying drawings in which:-
- Figure 1 is a diagram illustrating the preferential excitation of nuclear magnetic resonance in a slice of a body;
- Figure 2 illustrates the applied fields and resulting signal during the excitation procedure of Figure 1;
- Figures 3a to 3d illustrate the applied fields and signals during a conventional one dimensional EP NMR imaging method;
- Figures 4a, 4b and 4c illustrate the data obtained during a first experiment using the method of Figure 3;
- Figures 5a, 5b and 5c illustrate the data obtained during a second experiment using the method of Figure 3;
- Figures 6a, 6b and 6c illustrate the data .obtained during a third experiment using the method of Figure 3;
- Figures 7a to 7d illustrate the applied fields and resulting signals during a further one dimensional . EP NMR imaging method;
- Figures 8a, 8b and 8c illustrate a feature of the processing of the data obtained in the method of Figure 3;
- Figures 9a to 9d illustrate the data obtained during an experiment using the method of Figure 7;
- Figure 10 illustrates a feature of the method according to the present invention;
- Figures 11a to 11e illustrate the applied field and resulting signals during an NMR imaging method in accordance with the present invention;
- Figures 12a, 12b and 12c illustrate the data obtained during an experiment using the method of Figure 11;
- Figure 13 further illustrates the data obtained during an experiment using the method of Figure 11.
- Referring to Figure 1, consider an
extended body 1 placed in a polarizing magnetic field B0 and a magnetic field gradient Gz. As illustrated, in Figure 2, -such a system may be irradiated with a tailored selective RF pulse B1(t) applied along the x-axis in the rotating reference frame so as to excite preferentially those spins which lie in aslice 3 of the body (shaded) of thicknessΔz at displacement z. The corresponding range of Larmor frequencies excited is given approximately by
time 3/2 t w where tw is the RF pulse length. This is the case when |Gz| is constant. The unwanted x-component of signal may be minimized by subtle changes in the RF pulse shape. Since selection does not unduly perturb adjacent layers of material, rapid scanning of several layers may be achieved without the necessity of waiting T1, the spin lattice relaxation time, between different plane scans. - One dimensional mapping of the data contained in the signal of Figure 2c may be achieved by a conventional EP imaging procedure as illustrated in Figure 3.
- Figures 3a and 3b show the slice selection procedure described above with reference to Figure 2 together with an additional y-gradient (G ) modulation (Figure 3c), commenced at the focussed signal peak, the x-directional gradient (G ) being zero and therefore not shown. Gy is trapezoidally modulated (ideally rectangular) and in a perfectly homogeneous static magnetic field B0 produces an initial FID followed by a sequence of modified spin echoes 2nτy <T2 where T2 is the spin-spin relaxation time. This part of the procedure is identical to a standard alignment procedure in EP imaging. Indeed, if the
body 1 is a homogeneous cylinder of material of a single.chemically shifted species then the selected slice of material, Figure 4a, is a homogeneous disc. The spin projection of this disc in a static gradient Gy gives a semi-elliptic absorption line shape g(ω)(dotted Figure 4b). This is obtained by sampling just the initial FID. The effect of sampling the complete spin echo sequence of Figure 3d and Fourier transforming is to convert the continuous projection profile (dotted) into the discrete stick spectrum, Figure 4b. The stick spacing Δωy is related to the spin echo period 2τ and the number of data sample points P with sampling time τo by the following relationships

- This assumes that odd and even echoes are equivalent. The situation when this is not the case is discussed more fully later.
- The process of converting the continuous projection profile into a stick spectrum effectively squeezes signals obtained from the continuous spectrum in the range Δωy (that is to say, the area under the profile) into a single frequency stick, with equal area and centred within the frequency element.
- This bunching together of data gives an improved signal/noise ratio (S/N) for the stick spectrum. The total signal intensity arises from corresponding object strips of width Δy (shaded) in Figure 4a.
- If the data of Figure 4b are reordered into a matrix array, a hybrid "image" is obtained in which the vertical axis is the X coordinate and the horizontal axis is angular frequency, here labelled for convenience as 6. That is to say, in standard EP alignment procedure there is a space versus frequency plot of an excited slice within a continuous specimen. Each point in the y-8 map has the same δ shift (i.e. vertical lines or streaks), but streak intensity may vary (height of the stick spectra), because we have considered so far a specimen with just one spin species having one value of y. However, when we have a sample with several spin species, or more practically, one species with several different chemical environments giving rise to several chemically shifted spin sites, then provided they are all excited in the initial selective excitation sequence, these chemically shifted nuclei will give rise to several frequencies which will appear in the FT spectrum. However, there is another important proviso or condition referred to later which must be fulfilled, even for this rather limited y-5 plot to be achieved in practice.
- Use of the above described procedure to investigate a specimen as shown in Figure 5a which comprises three tubes A, B and C each containing material of different chemical shift, δA, δB and δC will now be considered.
- As shown, the tubes are separated along the y-axis and therefore the chemical shift map and its projection spectrum can be unambiguously assigned. That is to say, the signal from tube A can be unambiguously assigned to the absorption peak δA, Figure 5c,via the y-5 plot of Figure 5b. In this case the encoding is achieved entirely by Gy and by appropriately placing the tubes with y displacements so that no overlap occurs.
- However, in more general specimens, where the chemically shifted species are not so conveniently spaced, unambiguous assignment of spectra can be very difficult, if not impossible. As a simple illustration of this point, consider the specimen of Figure 6a, which again comprises three tubes A, B and C containing material with respective chemical shifts δA, δB and δC. In this example, tube A is well displaced from the other tubes along the y-axis. Tubes B and C are the same size, their centres having the same y coordinate. These tubes are therefore not separated along the y-axis. The y-δ map, Figure 6b, again has three streaks but only δA can be unambiguously assigned. Without knowing beforehand, there is insufficient information to decide whether δ1 belongs to tube A or B. Therefore the projection spectrum, Figure 6c is ambiguous.
- Reference is made above to a condition which is a prerequisite to make even the above described y-δ mapping work. Before broadening the discussion to full two dimensional mapping the basic assumptions of Figure 3 must be examined. In that case a homogeneous cylinder of spins with one Larmor frequency only was considered. In this special case Fourier transformation of the spin echo sequence gives the stick spectrum as described provided that the disc of material is centrally placed in the object field. For in this case, the spin projection profile of the object is the same in both +G and -Gy. However, for a general non-homogeneous and irregularly shaped object, which is arbitrarily placed in the object field, the projection in +G is not the same as that in -Gy. They are mirror images. This means that the above experiments with various tubes and chemical shifts will not work as described. Modifications to overcome this problem are next discussed.
- Experiments will now be described which overcome the above raised objections and allow one dimensional mapping of an arbitrary object with 6 shifted regions. It is emphasized that these experiments will not give unambiguous chemical shift assignments to the object unless the chemically shifted regions are well spaced so as not to overlap along one axis (the y-axis, for example).
- To overcome the above-mentioned mirror reflection problem and also spatial resolution problems, two methods are proposed. In the first method, Figure 7, slice selection in period TE (Figures 7a, 7b) is followed by G7 modulation (Figure 7c) and complete signal and echo sampling in time TS (Figure 7d), which in turn is followed by a delay.period TD. The experimental-cycle time TC is therefore given by

- In odd cycles, the phase of Gy starts positively shown by the solid line of Figure 7c. However, in even cycles, the Gy phase starts negatively, as indicated by the dotted line of Figure 7c. Successive odd and even signals are then first edited in the time domain by splicing from both signal trains all echoes formed in positive gradients. Likewise, an all negative gradient signal may be formed. Both spliced signals are now Fourier transformed to yield two separate stick profiles, one formed wholly in +Gy, the other in -G . These spectra are mirror images of each other and must be reordered in the frequency domain before co-adding to give S/N improvement. This procedure is clarified by reference to Figure 8 which shows two discs (Figure 8a) and their respective projections (Figures 8c and 8e) in a +y gradients (Figures8b and Figures 8d). If the wholly positive data are not sorted out from the negative data as described above or by other means, there is image overlap, even with one homogeneous disc of material characterized by one δ, should the disc be off centre in the object field.
- As an example of expected y-δ maps, consider Figure 9a in which the specimen comprises two discs A and B with chemical shifts δA and δB respectively. Figure 9b shows the stick projection spectra in both +G y (solid) and -Gy (dotted). The separated y-δ maps are shown in Figure 9c and are assignable. But the map obtained without performing the double shot experiment and subsequent editing and splicing procedure discussed above leads to a y-δ map which overlaps along the y-axis (see Figure 9d) through two causes. The first is an aliasing like effect when one or more of the specimens fills more than half the object field along the y direction. The second effect, more subtle, arises through a resolution loss along the y-direction due to a discontinuity of the echo evolution in alternate positive or negative gradients. It results in a fuzziness of the streak edges over several pixels along the y-axis, and it too can lead to undesirable streak overlap with consequent ambiguity in assignment. Although the δA and 6B lines in the example are resolved along the frequency axis, there are in fact four streaks, two of which overlap. Such a y-δ map cannot lead to a completely unambiguous assignment, especially when dealing with the general case of continuously distributed spin systems encountered in biological specimens.
- The Gy phase alternated sequence described above is really a two shot experiment with Tn between shots. This is a perfectly satisfactory method of chemical shift mapping when time is not of primary concern. However, if a complete one shot experiment is necessary, it is straightforward to combine the two phases of the experiment into a single experiment in which TD is effectively zero between phase alternated pairs. In this case the first and second selective RF pulses must have nutation or flip angles of 45° and 900 respectively. Other combinations of lower flip angle are also possible.
- The discreteness arising from the periodic nature of the spin echo formation places constraints on the frequency range δωy in each line of the y-δ plot, if wraparound (aliasing) and possible overlap of the chemically shifted species present is to be avoided. The largest chemical shift difference must satisfy the condition that

- It is emphasized again that y-6 mapping is only of limited usefulness. In Figure 6a there is demonstrated the problem of ambiguity which arises when chemically shifted species have the same y coordinates. Another way of overcoming this problem is to view the object from various projection directions and thereby resolve the chemical shift information in the plane. This approach may well be useful, since each projection if performed as described above, yields a y-6 map and such a set of maps contains all the requisite information to reconstruct an x, y-6 map by standard filtered back projection methods.
- There will now be described a method in accordance with the invention for obtaining full two dimensional chemical shift spectra, without recourse to image reconstruction from a projection set.
- Encoding along the x-axis is achieved by applying an additional G gradient as well as the. G gradient already described. The process is similar to EP imaging and for proper interpretation of the shift spectra corresponding spin density images are required. However, as explained later, full spin information including the spin density images are automatically available by the method described.
- In order to fully understand the three dimensional (x,y,δ) mapping process, we first consider the theoretical basis for EP imaging and then introduce the necessary modifications permitting mapping of δ (x,y,z).
- Initial excitation of the spin system may be by using a non-selective pulse to excite all spins within the transmitter coil volume. In this case, we would produce a 4-dimensional map (x,y,z,δ). This is clearly possible from a theoretical point of view and in this case the FID signal in the rotating reference frame at time t following the pulse is given by

- Full 4-dimensional mapping will be technically difficult to perform and in view of the large data handling and storage problem may be even undesirable. For this reason, we shall restrict the discussion to three-dimensional mapping, i.e. production of x,y-8 maps. In this case Equation (6) can be reduced to


- In certain instances it might be valuable to further - select a small area of interest within a chosen slice. This may be achieved by static magnetic field shaping (TMR) or purely by a selective excitation procedure or by a combination of both methods. In any event, the object of such a procedure would be to improve localized pixel resolution without overburdening the data handling capacity of the system. For.example, with such tailored sequences, a zoom facility could be constructed to look in finer detail at a single organ like the heart or a kidney without the need to examine the whole body cross- section. This facility would be of value in straightforward NMR imaging as well as in mapping of other NMR parameters, such as δ, flow, T1, T2, etc.
- In normal two dimensional EP imaging, only Gy(t) is a function of time. The so-called read gradient G is usually applied as a single step. In a method according to the present invention Gx(t) is also a periodic function of time. Equation (9) may be written as


- Fourier transformation of Equation (12a) gives for large N
 denotes convolution with the Fourier transform of the editing function E(ωy), etc. The angular frequency element

- The element Δy is the spatial displacement of the sticks in the spectrum of Equation (13).
- It will be noted that splicing the two time functions, Equations (12a and b) can give a related time function which represents evolution of the spin system in either a wholly positive gradient +Gy (t) or a wholly negative gradient -Gy (t). The two re3ated functions are


- It will be seen that both new spliced functions are modulo 2τ. In practice, these generated functions may be obtained by an editing function which appropriately pieces together two echo sequences. Fourier transformation of Equation (15a) gives


- The function F- gives a similar result but since it is produced in -Gy, the summation runs in reverse order, m = + ∞--∞ which is equivalent to changing the sign in the delta function of Equation (16) from - to +, i.e. δ (ω y + mΔω ).
- The inverse Fourier transform of Equation (16) is


- In this arrangement, because of the periodic time dependence introduced through Gx(t), discreteness along x follows automatically. Fourier transformation of h+ for example gives


- The function h- gives on Fourier transformation H-. which is similar to Equation (22).
- The inverse transform of Equation (22) gives h+ which when substituted for h(mAy,t) in Equation (19b) gives the fully spliced or edited function


- It will be apparent from the forgoing analysis that Equation (24) is one of four spliced functions, i.e. S++, S+-, S-+, and S--, which may be produced. Each function contains all the spatial information or spin density and by a suitable data reordering process in the frequency domain, these functions may be coadded to improve signal/noise. In the following discussion, we shall simply consider S++.
- The effect of modulating Gx, here assumed to be at a lower modulation frequency (longer period for square wave modulation) in addition to modulating Gy is to produce a slow amplitude modulation of the faster spin echoes produced in G (t). This additional modulation splits the stick spectra in Gy into multiplets, as shown in Figure 10. (A constant broadening gradient Gx broadens the sticks as in the usual EP experiment).
- For non-overlap of the spectral components we require


- From the above we see also that

- We also note that


- All calculations so far are performed in the rotating reference frame which rotates at ω0or at some fixed offset ΔΩ from ω0.Following focussed selective excitation, it is assumed for simplicity that the signal comprises a number of isochromatic components, the frequency spread of which are small compared with the slice width in appropriate frequency units. At the start of this EP modification, therefore, it is assumed that all components of our chemically shifted spin system are in phase. Any phase deviations will appear as a FID amplitude loss at this point. Chemically shifted regions will introduce an additional frequency dependence into Equation (9) which will itself reflect a spatial dependence. Thus the FID and response Equation (9) becomes

- In fact, although δ(x,y) is a continuous function of the position coordinates, it is convenient to break down the integral to a discrete sum of common chemical shifts, localized at specific parts of the object. The total chemically shifted distribution may be represented as weighted sum of shift components, i.e.

- In this case, our previous result for the fully spliced response function Equation (24) is easily generalized for j chemically shifted regions, to give


- That is to say a


- We also see from Equation (34) that for full unambiguous assignment of


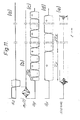
- The.complete procedure in one method according to the invention will now be described with reference to Figure 11.
- Slice selection (Figures 11a and 11b) is achieved as described above.
- Figures 11d and 11c respectively show the modulation diagrams for G x and G y which may be used in practice. Experimental difficulty will arise due to G switching at an echo peak, but since the signal is likely to be quite small here anyway, editing these echoes may not be too troublesome.
- In this example L = M = 8 and N = 16, giving P = 1024. This means that the spatial part or image field is described by an 8 x 8 matrix while the 6 dimension has 16 points. Let the experiment last 64 msec taking in 2048 (or 1024) time data points, half of which are zero filled in the FT. From equations(31)above, 2τX= TS/N = 4.0 msec and 2τyTS/LN = 0.5 msec. The FT produces 1024 frequency points each with Δωp/2π = 16 Hz/ point. At 940 G the Larmor frequency is 4.0 MHz. The point shift therefore, corresponds to 4 p.p.m. The total span of chemical shifts observable in this experiment without overlap or wraparound is therefore 16 x 4 = 64 p.p.m. Materials must therefore be chosen such that their natural frequency spread does not exceed 64 p.p.m. (see Equation (35)).
- Considering now the two dimensional object field of Figure 12a. This contains three discs of homogeneously distributed material and having two chemical shifts δ1 and δ2 as shown. Figure 12a also shows the continuous one dimensional projection spectra along the two principal axes. If now Gy alone is modulated (Gx= 0) we obtain six y sticks from the δ1 shifted zones and two smaller sticks arising from the δ2 shifted region, as shown in Figure 12b. The stick spectrum profiles are semi-elliptical in all cases, since the objects are homogeneous discs. If now the G modulation is added, we obtain a splitting of each y stick into a multiplet as shown for two cases y2 and y5 in Figure 12c. In the case described, there are in general 64 lines in this spectrum. It is important to realize that as sketched, it is rather assumed that the lines arising from δ1 are used as the reference. That is to say, we have arranged that δ1 falls in the middle of the δ shift range. However, it is clear that this is arbitrary and indeed one might wish in general to introduce a third shift purely as the reference compound.
- The spectrum of Figure 12c is in a form which is readily interpretable by stacking the 16 point data sets in the form of a third angle projection. This is illustrated in Figure 13afor the object of Figure 12a. In this form, it is immediately obvious that we have at our disposal the quantity of material and its chemical shift for every specified point in the x,y plane. The three dimensional plot can also yield other useful information. For example projection along the δ axis gives the spin density map Figure 13b. Projection along the x-axis gives the y - δ density plot, Figure 13c, which is the result obtained in
Section 2 without Gx. In a similar manner projection along the y-axis gives the x - δ density plot, Figure 13a. - While discussion has so far been restricted to chemical shift, it will be clear that the scheme described could be used to map the field distribution for a magnet. In this case, a material with no chemical shift distribution would be used. Such a single resonance compound should give single thin line streak patterns in the 6-x and 6-y projection plots. However, if there are magnetic field inhomogeneities, this will broaden and bend the streak patterns revealing the degree and position of such inhomogeneities.
- An interesting consequence of this new mapping procedure is that for protons, where chemical shifts are small anyway, provided some space exists in the δ dimension to accommodate static field inhomogeneities, the x,y projection or image will contain no inhomogeneity artefacts. Thus we have a way of removing undesirable spatial inhomogeneities in the static magnetic field. One consequence of this is that EP imaging may be satisfactorily performed in poorer magnets. However, the price paid is an increase in both the GX and Gy gradients.
- The ability to study material which produces localized magnetic inhomogeneities also exists. Finely divided iron and encapsulated iron and other magnetic materials may be orally administered. The passage of these materials can now be easily monitored in time course studies. Bulk susceptibility effects of haemoglobin and other magnetic materials in the liver may also be observable by these means.
- It will be appreciated that the method according to the inventions may readily be carried out by appropriately programming a known form of computer controlled NMR apparatus, for example, an apparatus as described in the UK Patent Specification No. 1,578,910 or No. 2,056,078.
Claims (7)
Applications Claiming Priority (2)
| Application Number | Priority Date | Filing Date | Title |
|---|---|---|---|
| GB8228567 | 1982-10-06 | ||
| GB8228567 | 1982-10-06 |
Publications (3)
| Publication Number | Publication Date |
|---|---|
| EP0105700A2 true EP0105700A2 (en) | 1984-04-18 |
| EP0105700A3 EP0105700A3 (en) | 1985-05-02 |
| EP0105700B1 EP0105700B1 (en) | 1989-01-04 |
Family
ID=10533428
Family Applications (1)
| Application Number | Title | Priority Date | Filing Date |
|---|---|---|---|
| EP83305804A Expired EP0105700B1 (en) | 1982-10-06 | 1983-09-28 | Nuclear magnetic resonance methods |
Country Status (5)
| Country | Link |
|---|---|
| US (1) | US4588948A (en) |
| EP (1) | EP0105700B1 (en) |
| JP (1) | JPS5990552A (en) |
| DE (1) | DE3378848D1 (en) |
| GB (1) | GB2128339B (en) |
Cited By (2)
| Publication number | Priority date | Publication date | Assignee | Title |
|---|---|---|---|---|
| EP0165610A2 (en) * | 1984-06-20 | 1985-12-27 | Hitachi, Ltd. | High speed imaging method with three-dimensional NMR |
| EP0240319A2 (en) * | 1986-03-31 | 1987-10-07 | Kabushiki Kaisha Toshiba | Magnetic resonance imaging system |
Families Citing this family (23)
| Publication number | Priority date | Publication date | Assignee | Title |
|---|---|---|---|---|
| US4689562A (en) * | 1983-10-11 | 1987-08-25 | Elscint Ltd. | NMR Imaging method and system |
| GB8415078D0 (en) * | 1984-06-13 | 1984-07-18 | Picker Int Ltd | Nuclear magnetic resonance imaging |
| JPH0811112B2 (en) * | 1985-03-11 | 1996-02-07 | 株式会社日立製作所 | Inspection equipment using nuclear magnetic resonance |
| JPH0714386B2 (en) * | 1985-04-10 | 1995-02-22 | 株式会社日立製作所 | Inspection device using nuclear magnetic resonance |
| US4678996A (en) * | 1985-05-07 | 1987-07-07 | Picker International, Inc. | Magnetic resonance imaging method |
| JPS61272644A (en) * | 1985-05-29 | 1986-12-02 | Yokogawa Electric Corp | Nuclear magnetic resonance image pickup device |
| JPS6250649A (en) * | 1985-08-30 | 1987-03-05 | Mitsubishi Electric Corp | Nuclear magnetic resonance imaging method |
| JPS62148658A (en) * | 1985-12-23 | 1987-07-02 | 株式会社日立製作所 | Examination method using nuclear magnetic resonance |
| JPS62231639A (en) * | 1986-03-31 | 1987-10-12 | 工業技術院長 | Analytical display of three-dimensional substance |
| US5168228A (en) * | 1987-05-14 | 1992-12-01 | National Researh Development Corporation | Echo planar imaging systems |
| JP2594953B2 (en) * | 1987-07-08 | 1997-03-26 | 株式会社日立製作所 | Inspection equipment using nuclear magnetic resonance |
| GB8719244D0 (en) * | 1987-08-14 | 1987-09-23 | Mansfield P | Nmr imaging |
| JPH021235A (en) * | 1987-11-06 | 1990-01-05 | Hitachi Ltd | Image reconstitution system of magnetic resonance imaging apparatus |
| US4901021A (en) * | 1987-11-06 | 1990-02-13 | Hitachi, Ltd. | Image constructing device included in a magnetic resonance imaging apparatus |
| GB8909270D0 (en) * | 1989-04-24 | 1989-06-07 | Hafslund Nycomed Innovation | Method |
| US5086275A (en) * | 1990-08-20 | 1992-02-04 | General Electric Company | Time domain filtering for nmr phased array imaging |
| US5151656A (en) * | 1990-12-11 | 1992-09-29 | General Electric Company | Correction of nmr data acquired by an echo-planar technique |
| JP3386864B2 (en) * | 1993-10-28 | 2003-03-17 | 株式会社日立メディコ | Nuclear magnetic resonance imaging method and apparatus |
| JP3369688B2 (en) * | 1993-12-27 | 2003-01-20 | 株式会社日立製作所 | Inspection equipment using nuclear magnetic resonance |
| US5652516A (en) * | 1996-01-22 | 1997-07-29 | The Board Of Trustees Of The Leland Stanford Junior University | Spectroscopic magnetic resonance imaging using spiral trajectories |
| US6285187B1 (en) | 1999-04-28 | 2001-09-04 | General Electric Company | Method and apparatus for reducing artifacts in echo planar imaging |
| US6259250B1 (en) * | 1999-04-28 | 2001-07-10 | General Electric Company | Method and apparatus for reducing artifacts in echo planar imaging |
| US9097778B2 (en) | 2009-03-30 | 2015-08-04 | Hitachi, Ltd. | Magnetic resonance device with diffusion gradient phase variation positionally corrected |
Citations (6)
| Publication number | Priority date | Publication date | Assignee | Title |
|---|---|---|---|---|
| US4115730A (en) * | 1976-04-14 | 1978-09-19 | National Research Development Corporation | Nuclear magnetic resonance apparatus and methods |
| DE2920549A1 (en) * | 1979-05-21 | 1980-12-04 | Siemens Ag | Magnetic field distribution measurement - uses gyromagnetic resonance stimulation and HF rotatable magnetic field gradient |
| EP0024640A1 (en) * | 1979-08-20 | 1981-03-11 | General Electric Company | Moving gradient zeugmatography |
| GB1596160A (en) * | 1976-12-15 | 1981-08-19 | Nat Res Dev | Nuclear magnetic resonance apparatus and methods |
| GB2079463A (en) * | 1980-03-14 | 1982-01-20 | Nat Res Dev | NMR imaging method |
| EP0076054A1 (en) * | 1981-09-21 | 1983-04-06 | Peter Mansfield | Nuclear magnetic resonance methods |
Family Cites Families (8)
| Publication number | Priority date | Publication date | Assignee | Title |
|---|---|---|---|---|
| US4021726A (en) * | 1974-09-11 | 1977-05-03 | National Research Development Corporation | Image formation using nuclear magnetic resonance |
| GB1601970A (en) * | 1978-05-31 | 1981-11-04 | Nat Res Dev | Methods of deriving image information from objects |
| US4318043A (en) * | 1978-07-20 | 1982-03-02 | The Regents Of The University Of California | Method and apparatus for rapid NMR imaging of nuclear densities within an object |
| US4339716A (en) * | 1979-05-23 | 1982-07-13 | Picker International Limited | Nuclear magnetic resonance systems |
| GB2057142B (en) * | 1979-08-10 | 1983-09-14 | Emi Ltd | Nuclear magnetic resonance systems |
| US4361807A (en) * | 1979-08-10 | 1982-11-30 | Picker International Limited | Nuclear magnetic resonance systems |
| US4607223A (en) * | 1982-08-13 | 1986-08-19 | National Research Development Corporation | Nuclear magnetic resonance imaging method |
| NL8203519A (en) * | 1982-09-10 | 1984-04-02 | Philips Nv | METHOD AND APPARATUS FOR DETERMINING A NUCLEAR MAGNETIZATION DISTRIBUTION IN PART OF A BODY. |
-
1983
- 1983-09-28 EP EP83305804A patent/EP0105700B1/en not_active Expired
- 1983-09-28 DE DE8383305804T patent/DE3378848D1/en not_active Expired
- 1983-09-28 GB GB08325918A patent/GB2128339B/en not_active Expired
- 1983-10-04 US US06/538,977 patent/US4588948A/en not_active Expired - Lifetime
- 1983-10-06 JP JP58187673A patent/JPS5990552A/en active Granted
Patent Citations (6)
| Publication number | Priority date | Publication date | Assignee | Title |
|---|---|---|---|---|
| US4115730A (en) * | 1976-04-14 | 1978-09-19 | National Research Development Corporation | Nuclear magnetic resonance apparatus and methods |
| GB1596160A (en) * | 1976-12-15 | 1981-08-19 | Nat Res Dev | Nuclear magnetic resonance apparatus and methods |
| DE2920549A1 (en) * | 1979-05-21 | 1980-12-04 | Siemens Ag | Magnetic field distribution measurement - uses gyromagnetic resonance stimulation and HF rotatable magnetic field gradient |
| EP0024640A1 (en) * | 1979-08-20 | 1981-03-11 | General Electric Company | Moving gradient zeugmatography |
| GB2079463A (en) * | 1980-03-14 | 1982-01-20 | Nat Res Dev | NMR imaging method |
| EP0076054A1 (en) * | 1981-09-21 | 1983-04-06 | Peter Mansfield | Nuclear magnetic resonance methods |
Cited By (4)
| Publication number | Priority date | Publication date | Assignee | Title |
|---|---|---|---|---|
| EP0165610A2 (en) * | 1984-06-20 | 1985-12-27 | Hitachi, Ltd. | High speed imaging method with three-dimensional NMR |
| EP0165610A3 (en) * | 1984-06-20 | 1986-10-01 | Hitachi, Ltd. | High speed imaging method with three-dimensional nmr |
| EP0240319A2 (en) * | 1986-03-31 | 1987-10-07 | Kabushiki Kaisha Toshiba | Magnetic resonance imaging system |
| EP0240319A3 (en) * | 1986-03-31 | 1989-08-30 | Kabushiki Kaisha Toshiba | Magnetic resonance imaging system |
Also Published As
| Publication number | Publication date |
|---|---|
| JPS5990552A (en) | 1984-05-25 |
| JPH0350534B2 (en) | 1991-08-02 |
| EP0105700B1 (en) | 1989-01-04 |
| GB2128339A (en) | 1984-04-26 |
| US4588948A (en) | 1986-05-13 |
| GB8325918D0 (en) | 1983-11-02 |
| DE3378848D1 (en) | 1989-02-09 |
| EP0105700A3 (en) | 1985-05-02 |
| GB2128339B (en) | 1986-09-17 |
Similar Documents
| Publication | Publication Date | Title |
|---|---|---|
| EP0105700B1 (en) | Nuclear magnetic resonance methods | |
| EP0047274B1 (en) | Methods of producing image information from objects | |
| EP0086972B2 (en) | Method of NMR imaging which overcomes T2* effects in an inhomogeneous static magnetic field | |
| EP0103397B1 (en) | Nuclear magnetic resonance imaging method | |
| EP0098426A2 (en) | Method of eliminating effects of spurious free induction decay NMR signal caused by imperfect 180 degrees RF pulses | |
| JP2000135206A5 (en) | A device for quantitative MR imaging of water and fat using a quadruple field echo sequence | |
| KR850002323A (en) | Nuclear Magnetic Resonance Data Generation Method | |
| US4628262A (en) | Multiple echo chemical shift imaging | |
| EP0222325A2 (en) | Method for reduction of MR image artifacts due to flowing nuclei by gradient moment nulling | |
| US5064638A (en) | Simultaneous multinuclear magnetic resonance imaging and spectroscopy | |
| JPH0287050A (en) | Method and device for forming two-dimensional spectrum of nmr signal by metabolic substance containing coupling spin | |
| EP0155052A1 (en) | Method of reducing artefacts in images formed by means of Fourier Zeugmatography | |
| JPH07265281A (en) | Mr imaging system | |
| US5241271A (en) | Ultra-fast imaging method and apparatus | |
| Zhou et al. | High‐field MR microscopy using fast spin‐echoes | |
| CA1108233A (en) | Methods of indicating nuclear spin density distribution | |
| JPH01502323A (en) | Method and apparatus for nuclear magnetic resonance imaging | |
| US4714884A (en) | Method of eliminating effects of spurious NMR signals caused by imperfect 180 degree RF pulses | |
| US4706023A (en) | Method of reducing artefacts in images formed by means of Fourier zeugmatography | |
| EP0541636B1 (en) | Improvements in, or relating to magnetic resonance spectroscopy and imaging | |
| US5541511A (en) | Method of magnetic resonance imaging for the production of rare images with additional preparation of the magnetization for contrast variation | |
| Cho et al. | Multipoint K‐space point mapping (KPM) technique for NMR microscopy | |
| EP0182873A1 (en) | Nmr fourier imaging from multiple echoes | |
| Mansfield | Nuclear magnetic resonance imaging | |
| JPH0475637A (en) | Magnetic resonance video device |
Legal Events
| Date | Code | Title | Description |
|---|---|---|---|
| PUAI | Public reference made under article 153(3) epc to a published international application that has entered the european phase |
Free format text: ORIGINAL CODE: 0009012 |
|
| AK | Designated contracting states |
Designated state(s): DE FR NL |
|
| PUAL | Search report despatched |
Free format text: ORIGINAL CODE: 0009013 |
|
| AK | Designated contracting states |
Designated state(s): DE FR NL |
|
| 17P | Request for examination filed |
Effective date: 19851010 |
|
| 17Q | First examination report despatched |
Effective date: 19870303 |
|
| GRAA | (expected) grant |
Free format text: ORIGINAL CODE: 0009210 |
|
| RAP3 | Party data changed (applicant data changed or rights of an application transferred) |
Owner name: MANSFIELD, PETER |
|
| AK | Designated contracting states |
Kind code of ref document: B1 Designated state(s): DE FR NL |
|
| REF | Corresponds to: |
Ref document number: 3378848 Country of ref document: DE Date of ref document: 19890209 |
|
| ET | Fr: translation filed | ||
| PLBE | No opposition filed within time limit |
Free format text: ORIGINAL CODE: 0009261 |
|
| STAA | Information on the status of an ep patent application or granted ep patent |
Free format text: STATUS: NO OPPOSITION FILED WITHIN TIME LIMIT |
|
| 26N | No opposition filed | ||
| PGFP | Annual fee paid to national office [announced via postgrant information from national office to epo] |
Ref country code: DE Payment date: 19981005 Year of fee payment: 16 |
|
| PG25 | Lapsed in a contracting state [announced via postgrant information from national office to epo] |
Ref country code: DE Free format text: LAPSE BECAUSE OF NON-PAYMENT OF DUE FEES Effective date: 20000701 |
|
| PGFP | Annual fee paid to national office [announced via postgrant information from national office to epo] |
Ref country code: NL Payment date: 20010927 Year of fee payment: 19 |
|
| PGFP | Annual fee paid to national office [announced via postgrant information from national office to epo] |
Ref country code: FR Payment date: 20020903 Year of fee payment: 20 |
|
| PG25 | Lapsed in a contracting state [announced via postgrant information from national office to epo] |
Ref country code: NL Free format text: LAPSE BECAUSE OF NON-PAYMENT OF DUE FEES Effective date: 20030401 |